How to create a GreenR map

Hi, I m following the steps for create a trees map for Santiago de Chile in the link GitHub - sachit27/greenR: greenR is an R package that enables the quantification, analysis, and visualization of urban greenness within city networks. It leverages data from OpenStreetMap (www.openstreetmap.org) and is implemented as both an R package and a Shiny web application for user-friendly interaction. and have no results. I think I have a problem with de osm data

library(greenR)
library(sf)
library(tidyverse)

install.packages("remotes") # Uncomment if you do not have the 'remotes' package installed

remotes::install_github("sachit27/greenR", dependencies = TRUE)
remotes::install_github ("ropensci/osmdata")

Obtener datos de OSM para Santiago de Chile

data <- get_osm_data("City of Santiago, Chile")

Calcular el índice verde

green_index <- calculate_green_index(data, crs = 4326)

Create a static plot

map <- plot_green_index(green_index)

Create an interactive plot using Plotly

map <- plot_green_index(green_index, interactive = TRUE)

Customize the plot

map <- plot_green_index(green_index, colors = c("#FF0000", "#00FF00"), line_width = 1, line_type = "dashed")

Hi, try this

data <- get_osm_data("Santiago, Chile")
green_index <- calculate_green_index(data, 4326)

I just tried it and it works fine.

Also, if you are having issues with osmdata R package, I would suggest installing it from Github

remotes::install_github ("ropensci/osmdata")

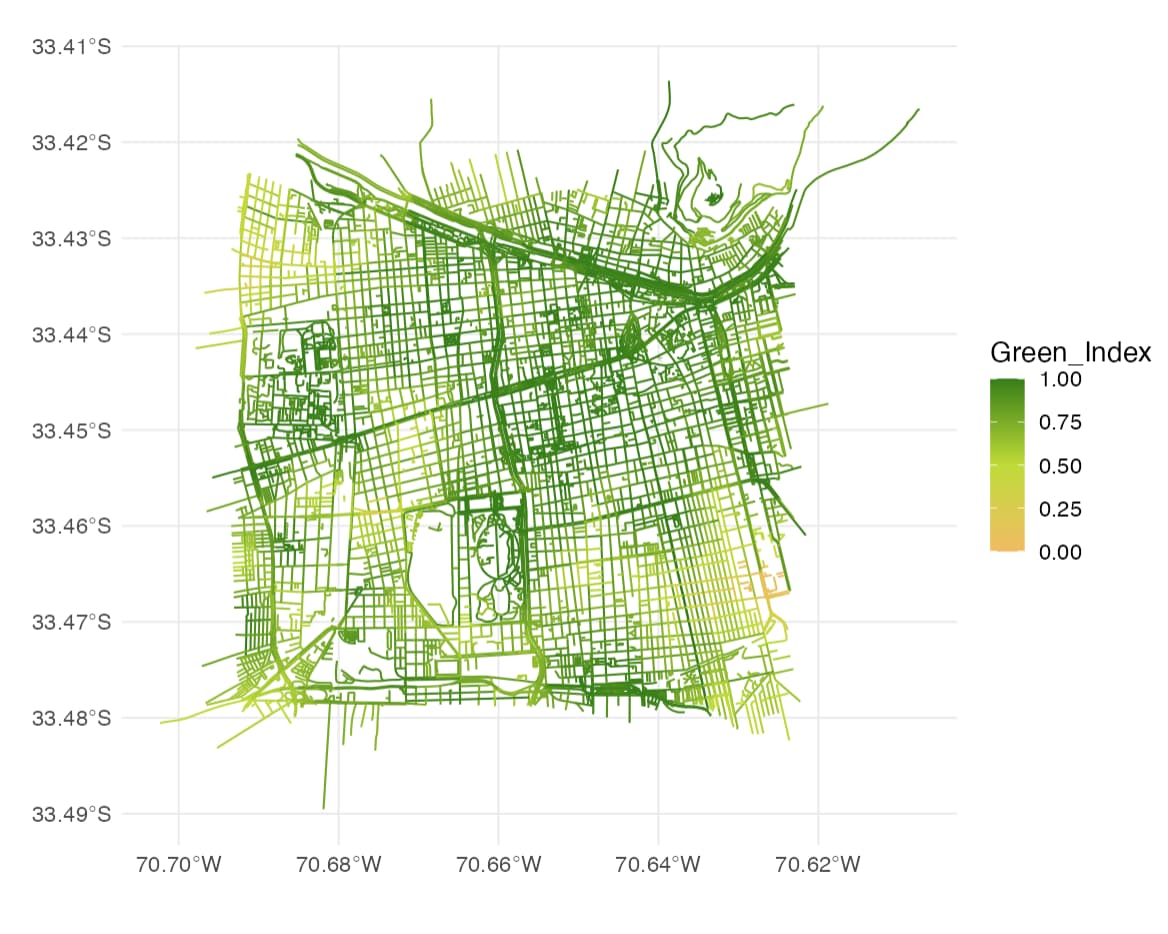
thank you very much, @Sachit_Mahajan . One more question: ("Santiago, Chile") in this case is the Municipality of Santiago, that is inside the city of Santiago. Do you know how can I do the same for the complete city? Best wishes

Hye, I am using greenR for creating green index map of Delhi but after giving the following command
data <- get_osm_data("Delhi, India")
no result is coming out neither any error nor any output. On the other hand, when I am replacing Delhi with New Delhi then is showing the results but that doesn't covers the entire area of Delhi, its just covering new Delhi and a few other areas. What could be done to make this work? Kindly help.

-Thankyou

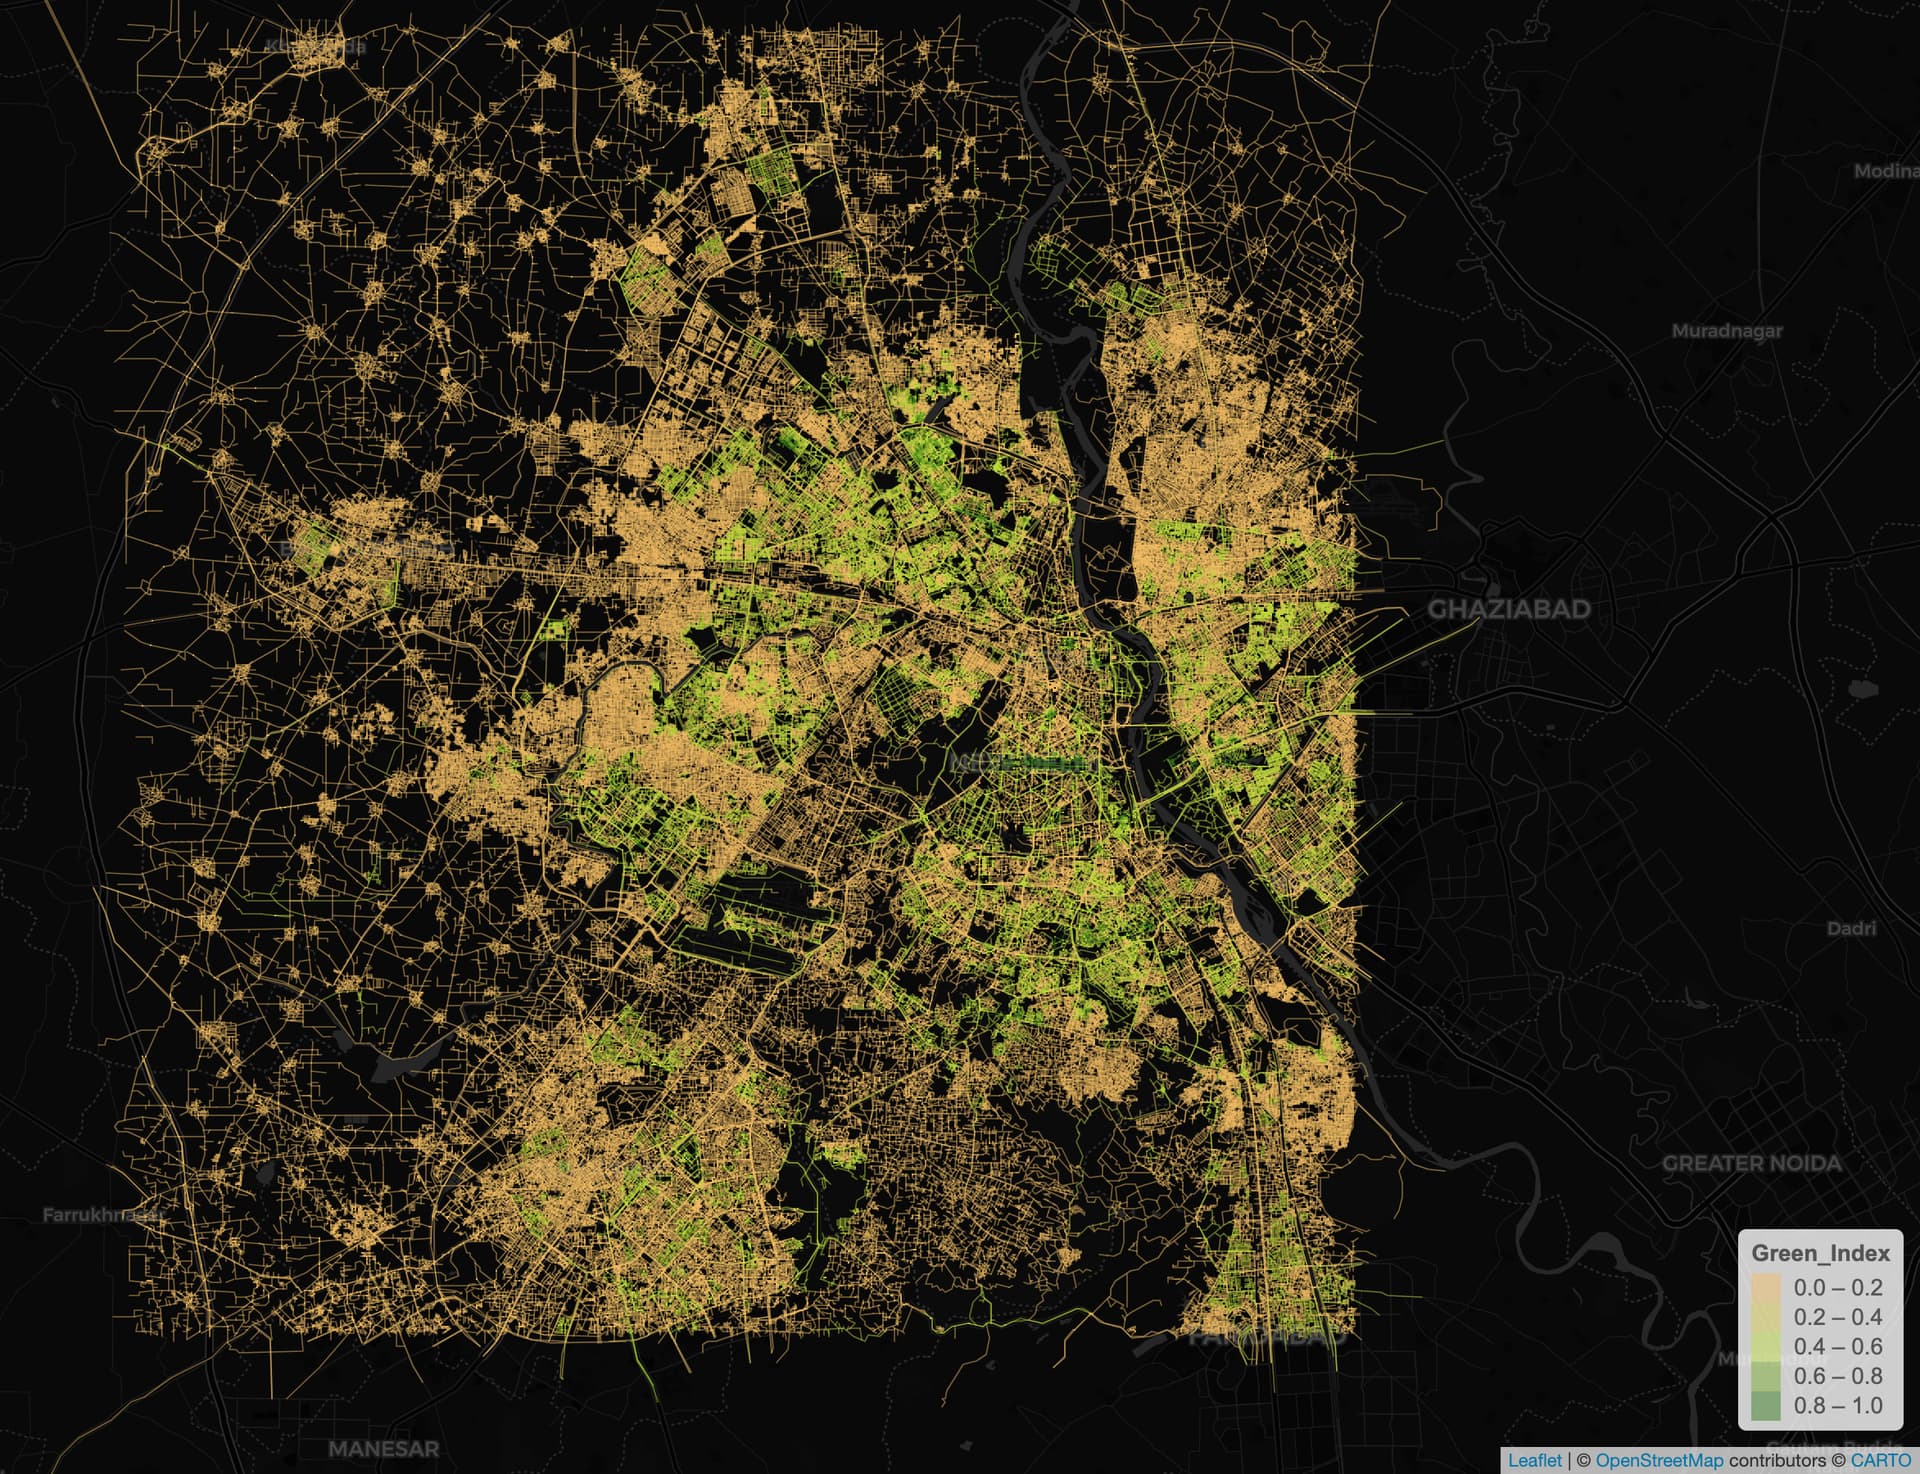
Hi, this is a bit strange. When I am testing it, I can see and visualize the data.

library(greenR)
ndata <- get_osm_data("Delhi, India")
new_green_index <- calculate_green_index(ndata, 7780) #you have to make sure that you use the right code
map <- plot_green_index(new_green_index, interactive = TRUE, base_map = "CartoDB.DarkMatter")
print(map)

As it is a big network, it can take a while depending on your computation resources.

This topic was automatically closed 42 days after the last reply. New replies are no longer allowed.

If you have a query related to it or one of the replies, start a new topic and refer back with a link.