I want to create similar star graph using Rstudio. Inorder to create similar graph which library should I use? 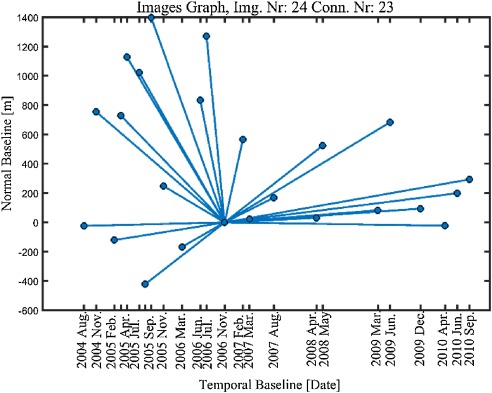
Hi @Gokul,
How's this for a first quick attempt? You can change what point is the "centroid" of the plot for whatever makes sense in your application.
library(tidyverse)

set.seed(12345)
data <- tibble(
  x = runif(20, 0, 10),
  y = runif(20, 0, 10)
)

# sample one point to be the centroid of the hub
centroid <- sample_n(data, 1)

data %>%
  ggplot(aes(x, y)) +
  geom_point() +
  geom_segment(aes(x = centroid$x, y = centroid$y,
                   xend = x, yend = y)) +
  theme_minimal()
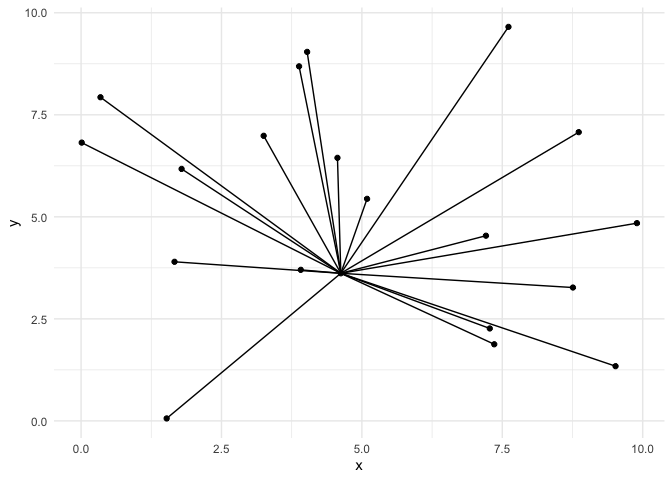
Created on 2020-04-04 by the reprex package (v0.3.0)
3 Likes
Thank you for your time. This is the one I required, let me see if I can make it using my data.
I tried to create the graph using my data. But it keeps coming errors. I am attaching the file
Could you plot this using date of acq. as x and Bperp as y ?
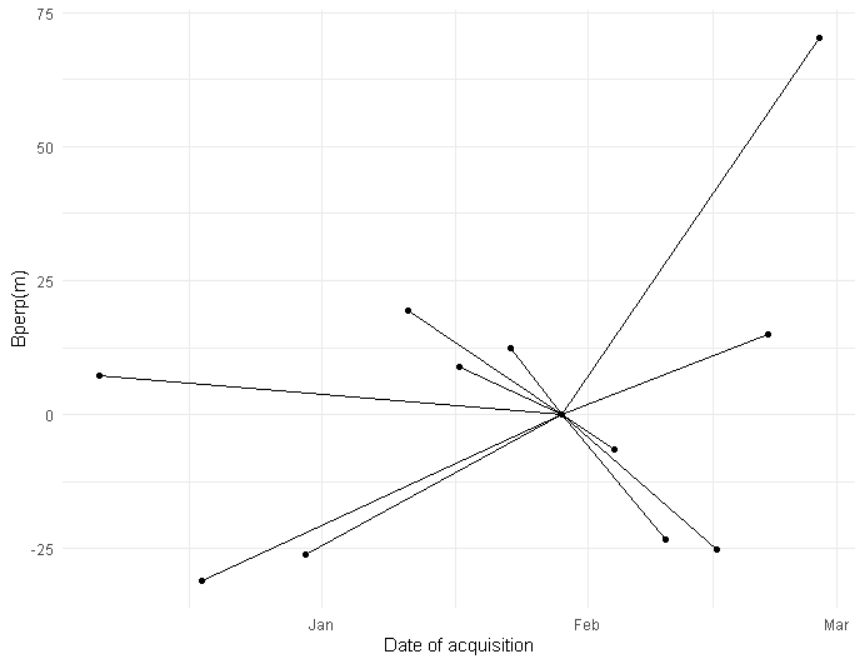
library(tidyverse)
library(readxl)


data <- readxl::read_excel("Sentinel-1 Metadata info.xls")
centroid <- slice(data,1)

data %>%
  ggplot(aes(`Date of acquisition`, `Bperp(m)`)) +
  geom_point() +
  geom_segment(aes(x = centroid$`Date of acquisition`, y = centroid$`Bperp(m)`,
                   xend = `Date of acquisition`, yend = `Bperp(m)`)) +
  theme_minimal()
2 Likes
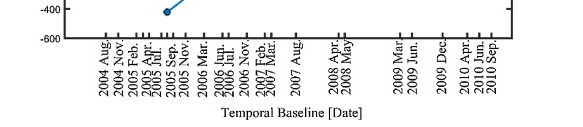
I need one more favour. Actually I tried to do it myself but it didn't work out well and I have less time to fix it. It would be very much helpful if you can show to add all the dates as breakpoints for x axis
Thank you.
Still I couldn't fix this problem and stuck at this stage. I would really appreciate if anyone could fix my issue here
If your date variable is a proper date, and you're using ggplot() for plotting, you can add a scale_x_date() to your plot call and modify how the dates are presented by tweaking the date_breaks = ... argument.
Pseudo-code:
ggplot(data, aes(x, y)) +
  geom_col() +
  scale_x_date(date_breaks = 'day')
This topic was automatically closed 7 days after the last reply. New replies are no longer allowed.