You can rotate the text
library(ggplot2)
tabela_sort <- data.frame(
stringsAsFactors = FALSE,
Number = c(47, 7, 6, 30, 12, 101),
Country = c("Guyana","Armenia",
"Bangladesh","Egypt","Vietnam","Suriname"),
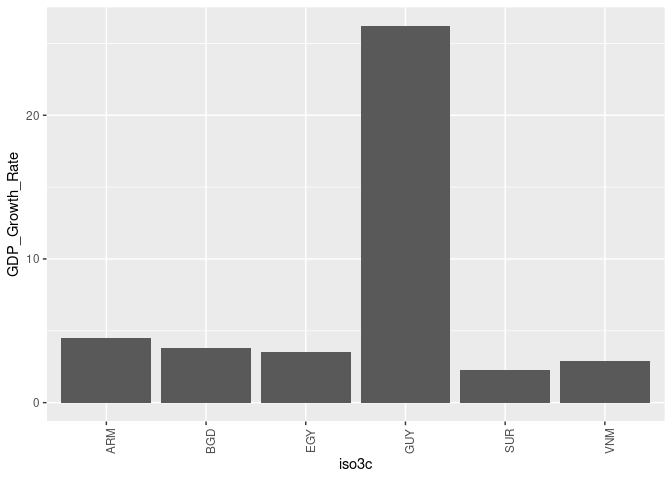
GDP_Growth_Rate = c(26.2, 4.5, 3.8, 3.5, 2.91, 2.3),
iso3c = c("GUY", "ARM", "BGD", "EGY", "VNM", "SUR")
)
ggplot(tabela_sort, aes(x = iso3c, y = GDP_Growth_Rate)) +
geom_col() +
theme(axis.text.x = element_text(angle = 90))
Created on 2021-06-13 by the reprex package (v2.0.0)
Note: Next time please provide a proper REPRoducible EXample (reprex) illustrating your issue.