Hi all,
head(tabela_sort)
    Number    Country GDP_Growth_Rate iso3c
46      47     Guyana           26.20   GUY
6        7    Armenia            4.50   ARM
5        6 Bangladesh            3.80   BGD
29      30      Egypt            3.50   EGY
11      12    Vietnam            2.91   VNM
100    101   Suriname            2.30   SUR
I would like to create a bar chart right now showing on the axis y the GDP_Growth_Rate value by iso3c column on axis x.
However, if I use
ggplot(tabela_sort, aes(x = Country, y = GDP_Growth_Rate)) + geom_bar(stat = "identity")
I get
Thanks in advance!
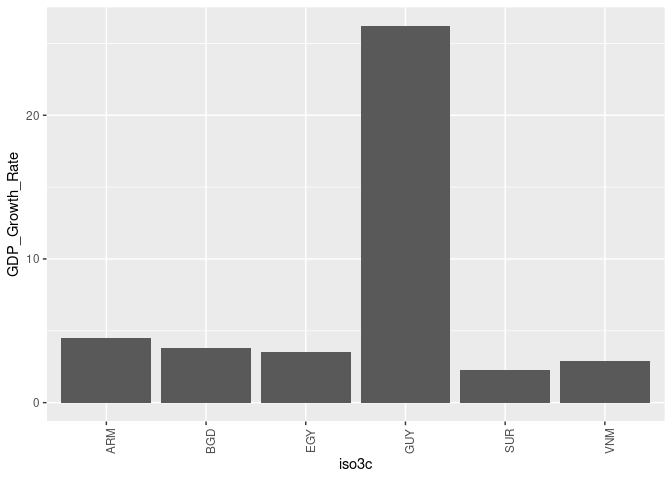
You can rotate the text
library(ggplot2)

tabela_sort <- data.frame(
  stringsAsFactors = FALSE,
            Number = c(47, 7, 6, 30, 12, 101),
           Country = c("Guyana","Armenia",
                       "Bangladesh","Egypt","Vietnam","Suriname"),
   GDP_Growth_Rate = c(26.2, 4.5, 3.8, 3.5, 2.91, 2.3),
             iso3c = c("GUY", "ARM", "BGD", "EGY", "VNM", "SUR")
)

ggplot(tabela_sort, aes(x = iso3c, y = GDP_Growth_Rate)) +
    geom_col() +
    theme(axis.text.x = element_text(angle = 90))
Created on 2021-06-13 by the reprex package (v2.0.0)
Note: Next time please provide a proper REPR oducible EX ample (reprex)
Thank you andresrcs! However my dataframe has 190 entries which I would like to use as values on the axis x
> head(table)
# A tibble: 6 x 4
   Rank Country    GDP_Growth_Rate iso3c
  <int> <chr>                <dbl> <chr>
1    47 Guyana               26.2  GUY
2     7 Armenia               4.5  ARM
3     6 Bangladesh            3.8  BGD
4    30 Egypt                 3.5  EGY
5    12 Vietnam               2.91 VNM
6   101 Suriname              2.3  SUR
library(countrycode)
library(rvest)
content <- read_html("https://en.wikipedia.org/wiki/List_of_countries_by_real_GDP_growth_rate")
tables = content %>% html_table(fill = TRUE)
table = tables[[2]]
table$iso3c <- countrycode(table$Country, "country.name", "iso3c")
colnames(table) = c("Rank", "Country", "GDP_Growth_Rate", "iso3c")
table$GDP_Growth_Rate <- as.numeric(table$GDP_Growth_Rate)
table <- table[order(table$GDP_Growth_Rate, decreasing = TRUE),]
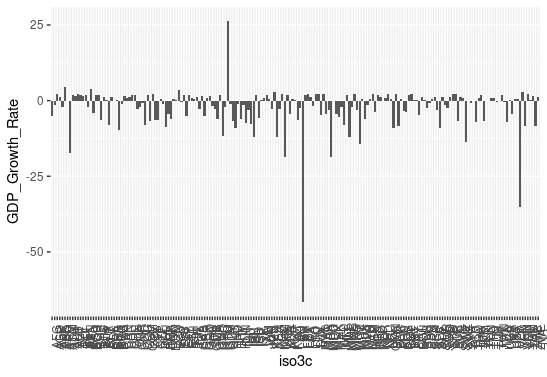
ggplot(table, aes(x = iso3c, y = GDP_Growth_Rate)) +
+ geom_col() +
+ theme(axis.text.x = element_text(angle = 90))
If I rotate the text, I get the chart below which is unfortunately still illisible
I think you just have too many countries to get a plot that will look okay on an A4/8 1/2 x 11 output.
You can try a coord_flip which may help a bit:
ggplot(table, aes(x = iso3c, y = GDP_Growth_Rate)) +
       geom_col() + coord_flip()
but I think you will have to add a column to the data that will allow you to facet the graph.
Thank, jrkrideau.
table$group <- ifelse(table$Rank <= 20, 1, ifelse(table$Rank > 20 & table$Rank <= 40,2,ifelse(table$Rank > 40 & table$Rank <= 60,3, ifelse(table$Rank > 60 & table$Rank <= 80,4, ifelse(table$Rank > 80 & table$Rank <= 100,5, ifelse(table$Rank > 100 & table$Rank <= 120,6, ifelse(table$Rank > 120 & table$Rank <= 140,7, ifelse(table$Rank > 140 & table$Rank <= 160,8, ifelse(table$Rank > 160 & table$Rank <= 180,9, 10)))))))))
So the table is:
> head(table)
# A tibble: 6 x 5
   Rank Country    GDP_Growth_Rate iso3c group
  <int> <chr>                <dbl> <chr> <dbl>
1    47 Guyana               26.2  GUY       3
2     7 Armenia               4.5  ARM       1
3     6 Bangladesh            3.8  BGD       1
4    30 Egypt                 3.5  EGY       2
5    12 Vietnam               2.91 VNM       1
6   101 Suriname              2.3  SUR       6
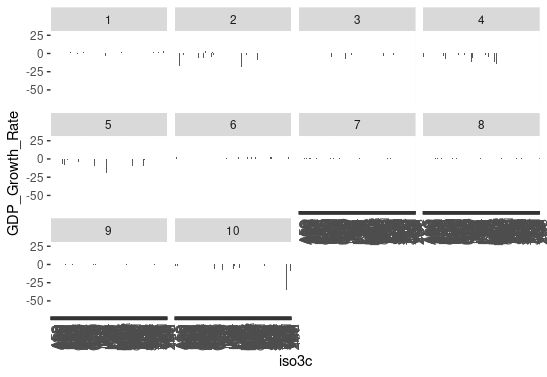
But it doesn't look like it helps.
ggplot(data = table, aes(x = iso3c, y = GDP_Growth_Rate)) + geom_col() + theme(axis.text.x = element_text(angle = 90)) + facet_wrap(~group)
produces a graph like this:
Try
ggplot(table, aes(x = iso3c, y = GDP_Growth_Rate)) +
       geom_col() + coord_flip()
coord_flip() will put the names on the vertical axis I think you need the faceting as well. You need the vertical axis for the names. Try just 2 or 3 groups. Ten groups looks like overkill.
tjmahr
June 15, 2021, 8:54pm
7
regneck:
facet_wrap(~group)
You need facet_wrap(..., scales = "free_x") so that only the unique countries in each panel are shown on that panel's x axis.
Thank you all for you replies. It looks like I need to play around the facets.
system
June 24, 2021, 7:08pm
9
This topic was automatically closed 7 days after the last reply. New replies are no longer allowed.