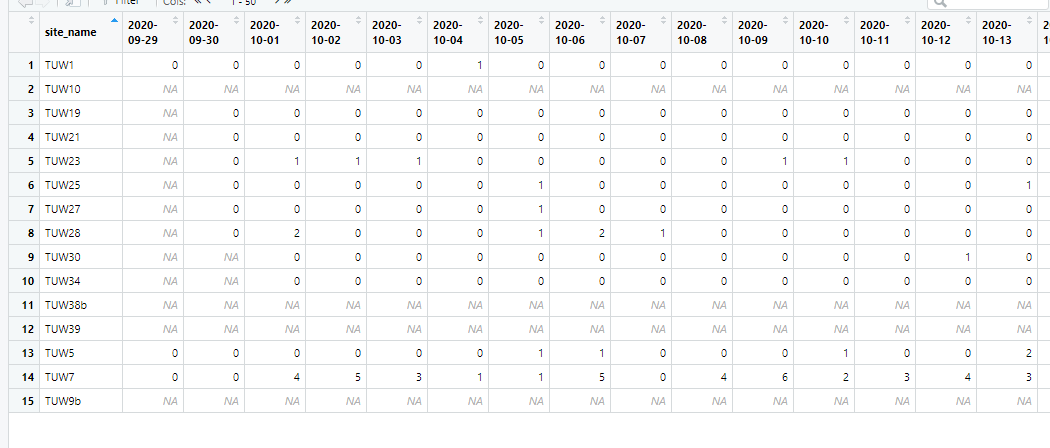
Hi, here is my table. The Y column is the number of different sites and the X column is the number of times where the animals have been spotted. I want to know for each site, how many days there are animals are being spotted(where the number is <1) I am new to R so I am not sure which code I need to use.
Run this to see an alternative approach that emphasizes thinking about data organization with a view to its desired uses beforehand, then building function objects to transform a data object into an object containing the desired result. Because of all the punctuation, eyes tend to glaze over, but in the longer run there really is far less to remember than with a focus on a recipe of do this then do that.
Couldn't do a reprex because RStudio is misbehaving.
# create fake data
basket <- c(0:3,NA)
make_fakes <- function(x) t(sample(basket,length(the_dates), replace = TRUE))
the_dates <- seq.Date(from = as.Date('2020-09-01'), to = as.Date('2020-10-31'), by = 'days')
observations <- length(the_dates)
d <- sapply(1:observations,make_fakes) |> data.frame()
the_sites <- paste0("TUW",1:61)
colnames(d) <- the_sites
d <- cbind(the_dates,d)
# d, the fake data data frame complete

# over all dates, count the number
# of times that each variable was
# below 1 and not NA
#
# because
NA < 1

# after removing NAs, sum the number of rows in a
# column that are less than 0
count_lows <- function(x) sum(d[x][[1]] < 1, na.rm = TRUE)
# make a data frame
result <- data.frame(low_counts = sapply(2:(dim(d)[2]),count_lows))
# add in the corresponding site names
low_counts$sites <- the_sites
# swap first and second column positions
low_counts <- low_counts[c(2,1)]
low_counts
# bonus: convert to time series and compare plots
the_start = c(2022, as.numeric(format(the_dates[1], "%j")))
series <- ts(d[2],start = the_start, frequency = 365)
par(mfrow = c(2,2))
plot(series, type = "l")
plot(series, type = "p")
plot(series, type = "h")
plot(series, type = "s")
series <- ts(d[3],start = the_start, frequency = 365)
par(mfrow = c(2,2))
plot(series, type = "l")
plot(series, type = "p")
plot(series, type = "h")
plot(series, type = "s")