How to convert this part of my function into a loop to reduce the redundancy?

I am trying to generate a function which will create a Kernel Density Estimation using spatial data. I would like to create a loop within the section of my function titled "# compute homerange ranges for a,b,c,d% and object is returned as spatial polygon data frames".

I am having trouble creating a for loop for this because the objects are returned as spatial polygon data frames. Is there any way someone can help me with this?

I have attached the code for my function below

magic_map<- function(datapoints, a, b, c, d, spatialdata, Data.type, Area.Name){

#Run the KDE
kde.output <- kernelUD(datapoints, h="href", grid = 1000)

#Convert to Raster
kde <- raster(kde.output)

Set projection to British National Grid

projection(kde) <- CRS("+init=EPSG:27700")

compute homerange ranges for a,b,c,d% and object is returned as spatial polygon data frames

a <- getverticeshr(kde.output, percent = a)
b <- getverticeshr(kde.output, percent = b)
c <- getverticeshr(kde.output, percent = c)
d <- getverticeshr(kde.output, percent = d)

tm_shape(spatialdata) + tm_fill(col = "#bab6b6" ) + tm_borders(alpha=.5, col = "white") +
tm_shape(datapoints) + tm_dots(col = "blue", size=0.005) +
tm_shape(d) + tm_borders(alpha=.7, col = "#a50f60", lwd = 2) + tm_fill(alpha=.3, col = "#a50f60") +
tm_shape(c) + tm_borders(alpha=.7, col = "#a50f15", lwd = 2) + tm_fill(alpha=.2, col = "#a50f15") +
tm_shape(b) + tm_borders(alpha=.7, col = "#de2d26", lwd = 2) + tm_fill(alpha=.15, col = "#de2d26") +
tm_shape(a) + tm_borders(alpha=.7, col = "#fb6a4a", lwd = 2) + tm_fill(alpha=.1, col = "#fb6a4a") +
tm_layout(frame = FALSE, main.title=(paste("Percent Volume Contours for", Data.type, "in", Area.Name, sep = " ")), main.title.size = 0.77)
}
Hi,

Welcome to the RStudio community!

There are several ways of going about what you like to to do. I present here a way I think is one of the most elegant with fewest lines of code. Although you provided us with your code, you did not create a reprex so I was not able to use any of your data or generate results specific for your question. Next time, please read the guide on how to create one so people will be able to answer faster. A reprex consists of the minimal code and data needed to recreate the issue/question you're having. You can find instructions how to build and share one here:

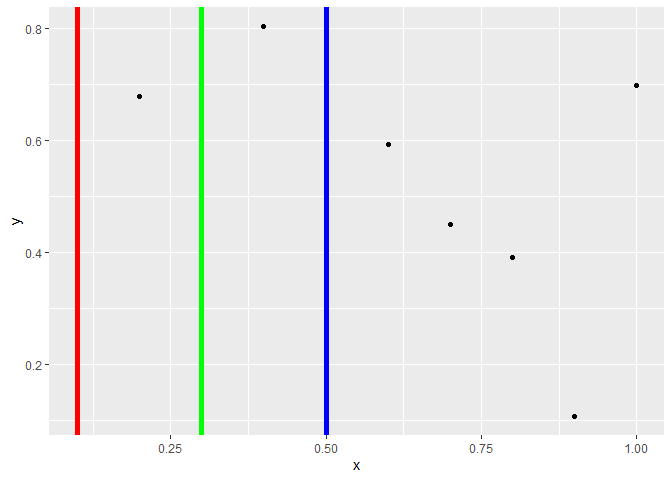
Here is an example of the technique with dummy data

library(ggplot2)

#The data for the base plot
baseData = data.frame(x = 1:10/10, y = runif(10))

#A list of parameters for all additional shapes that are different
shapeData = list(
  list(data = 10, colour = "red"),
  list(data = 30, colour = "green"),
  list(data = 50, colour = "blue"))

#Building the ggplot with all other shapes
ggplot(baseData, aes(x = x, y = y)) + geom_point() +
  sapply(shapeData, function(myData){
    geom_vline(xintercept = myData$data / 100, 
               colour = myData$colour, size = 2)
  })


Created on 2020-11-22 by the reprex package (v0.3.0)

Explanation
In ggplot, you can add multiple shapes at once by using the sapply() function from R. I created a list of lists (shapeData) where I storde all the parts that are different per shape. In your case that would be percent, col, alpha,..). When I use the apply function, I can then generate the same shape as many times as I have items in my list, and put the defined values in places I need them. If I have values that are the same for all shapes, I can just hard code them in (e.g. in my example size, in yours lwd or the first alpha). The result is a very clean ggplot code with a lot of redundancy saved.

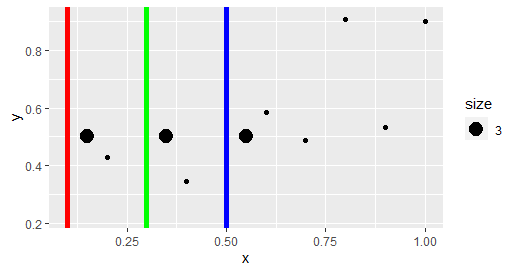
If you need to add multiple ggplot object in every iteration, like for you tm_shape, tm_borders, tm_fill you either repeat this process, or make list of object to return like this:

ggplot(baseData, aes(x = x, y = y)) + geom_point() +
  sapply(shapeData, function(myData){
    list(geom_vline(xintercept = myData$data / 100, 
               colour = myData$colour, size = 2),
         geom_point(aes(x = myData$data / 100 + 0.05, 
                        y = 0.5, size = 3)))
  }) 

OR

ggplot(baseData, aes(x = x, y = y)) + geom_point() +
  sapply(shapeData, function(myData){
    geom_vline(xintercept = myData$data / 100, 
                    colour = myData$colour, size = 2)
  }) +
 sapply(shapeData, function(myData){
    geom_point(aes(x = myData$data / 100 + 0.05, 
                   y = 0.5, size = 3))
  })

image

Hope this helps,
PJ

This topic was automatically closed 21 days after the last reply. New replies are no longer allowed.

If you have a query related to it or one of the replies, start a new topic and refer back with a link.