I have a kind question, working a lot with SPSS labelled data and trying to get a grasp of it in R.
I have read this:
Is there a way to convert res = sjPlot::view_df(df) to dataframe in R ?
This is a list, nice html list with nice output but I want df.
My second question would be how to export this res to excel or preserve this nice output.
This is really nice output but how to save it to other formats ?
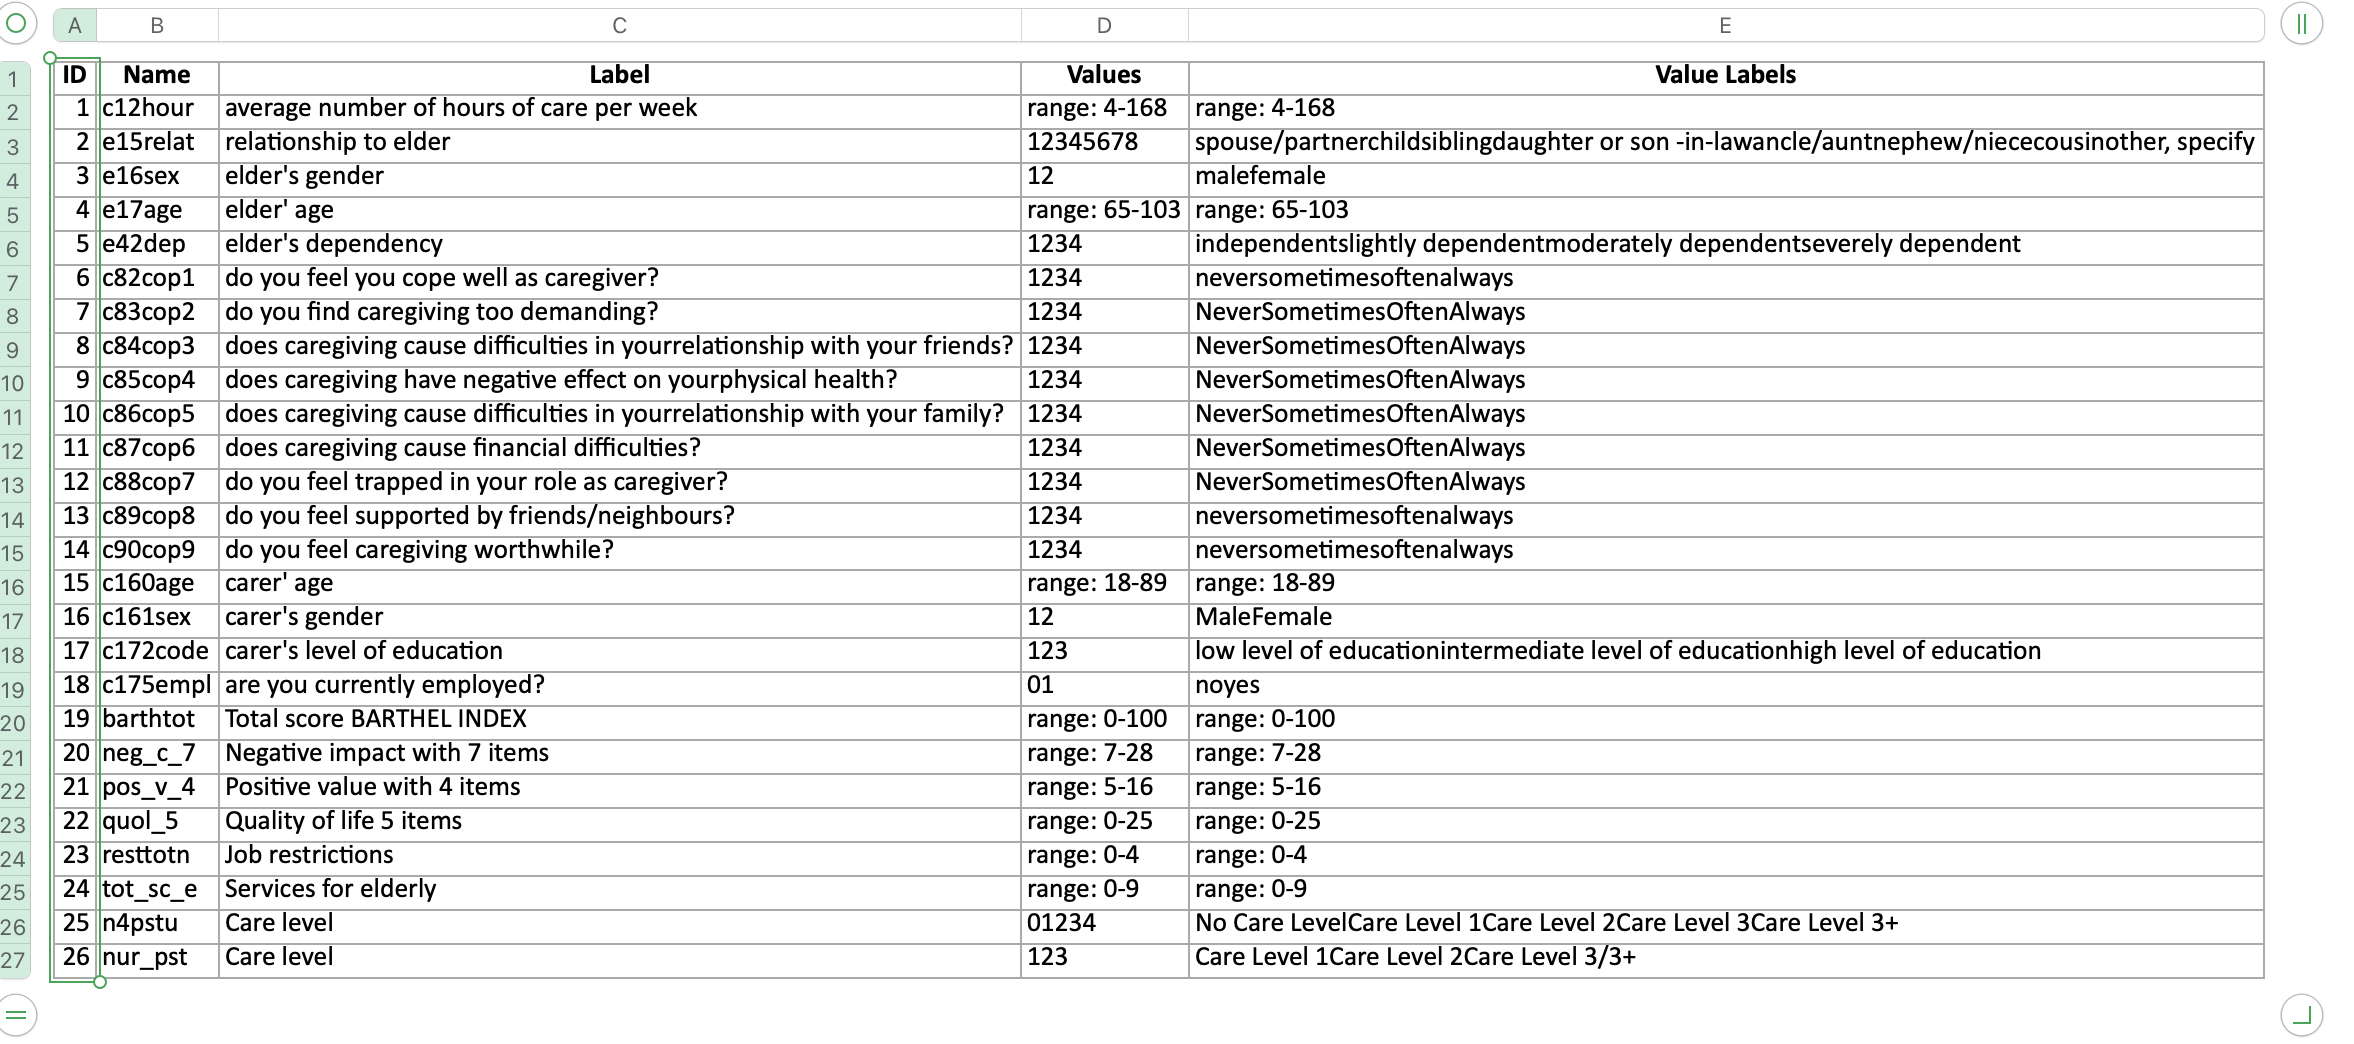
sjPlots::view_df() takes a data.frame as its argument and returns various components of an HTML page, including a complete page that you can save to file and import into Excel.
library(sjPlot)
data(efc)
output <- view_df(efc)
output$page.complete
#> [1] "<html>\n<head>\n<meta http-equiv=\"Content-type\" content=\"text/html;charset=UTF-8\">\n<style>\nhtml, body { background-color: white; }\ntable { border-collapse:collapse; border:none; }\n.thead { border-bottom:double; font-style:italic; font-weight:normal; padding:0.2cm; text-align:left; vertical-align:top; }\n.tdata { padding:0.2cm; text-align:left; vertical-align:top; }\n.arc { background-color:#eeeeee }\ncaption { font-weight: bold; text-align:left; }\n.omit { color:#999999; }\n</style>\n</head>\n<body>\n<table>\n<caption>Data frame: efc</caption>\n<tr>\n<th class=\"thead\">ID</th><th class=\"thead\">Name</th><th class=\"thead\">Label</th><th class=\"thead\">Values</th><th class=\"thead\">Value Labels</th>\n</tr>\n<tr>\n<td class=\"tdata\">1</td>\n<td class=\"tdata\">c12hour</td>\n<td class=\"tdata\">average number of hours of care per week</td>\n<td class=\"tdata\" colspan=\"2\"><em>range: 4-168</em></td>\n</tr>\n<tr>\n<td class=\"tdata arc\">2</td>\n<td class=\"tdata arc\">e15relat</td>\n<td class=\"tdata arc\">relationship to elder</td>\n<td class=\"tdata arc\">1<br>2<br>3<br>4<br>5<br>6<br>7<br>8</td>\n<td class=\"tdata arc\">spouse/partner<br>child<br>sibling<br>daughter or son -in-law<br>ancle/aunt<br>nephew/niece<br>cousin<br>other, specify</td>\n</tr>\n<tr>\n<td class=\"tdata\">3</td>\n<td class=\"tdata\">e16sex</td>\n<td class=\"tdata\">elder's gender</td>\n<td class=\"tdata\">1<br>2</td>\n<td class=\"tdata\">male<br>female</td>\n</tr>\n<tr>\n<td class=\"tdata arc\">4</td>\n<td class=\"tdata arc\">e17age</td>\n<td class=\"tdata arc\">elder' age</td>\n<td class=\"tdata arc\" colspan=\"2\"><em>range: 65-103</em></td>\n</tr>\n<tr>\n<td class=\"tdata\">5</td>\n<td class=\"tdata\">e42dep</td>\n<td class=\"tdata\">elder's dependency</td>\n<td class=\"tdata\">1<br>2<br>3<br>4</td>\n<td class=\"tdata\">independent<br>slightly dependent<br>moderately dependent<br>severely dependent</td>\n</tr>\n<tr>\n<td class=\"tdata arc\">6</td>\n<td class=\"tdata arc\">c82cop1</td>\n<td class=\"tdata arc\">do you feel you cope well as caregiver?</td>\n<td class=\"tdata arc\">1<br>2<br>3<br>4</td>\n<td class=\"tdata arc\">never<br>sometimes<br>often<br>always</td>\n</tr>\n<tr>\n<td class=\"tdata\">7</td>\n<td class=\"tdata\">c83cop2</td>\n<td class=\"tdata\">do you find caregiving too demanding?</td>\n<td class=\"tdata\">1<br>2<br>3<br>4</td>\n<td class=\"tdata\">Never<br>Sometimes<br>Often<br>Always</td>\n</tr>\n<tr>\n<td class=\"tdata arc\">8</td>\n<td class=\"tdata arc\">c84cop3</td>\n<td class=\"tdata arc\">does caregiving cause difficulties in your<br>relationship with your friends?</td>\n<td class=\"tdata arc\">1<br>2<br>3<br>4</td>\n<td class=\"tdata arc\">Never<br>Sometimes<br>Often<br>Always</td>\n</tr>\n<tr>\n<td class=\"tdata\">9</td>\n<td class=\"tdata\">c85cop4</td>\n<td class=\"tdata\">does caregiving have negative effect on your<br>physical health?</td>\n<td class=\"tdata\">1<br>2<br>3<br>4</td>\n<td class=\"tdata\">Never<br>Sometimes<br>Often<br>Always</td>\n</tr>\n<tr>\n<td class=\"tdata arc\">10</td>\n<td class=\"tdata arc\">c86cop5</td>\n<td class=\"tdata arc\">does caregiving cause difficulties in your<br>relationship with your family?</td>\n<td class=\"tdata arc\">1<br>2<br>3<br>4</td>\n<td class=\"tdata arc\">Never<br>Sometimes<br>Often<br>Always</td>\n</tr>\n<tr>\n<td class=\"tdata\">11</td>\n<td class=\"tdata\">c87cop6</td>\n<td class=\"tdata\">does caregiving cause financial difficulties?</td>\n<td class=\"tdata\">1<br>2<br>3<br>4</td>\n<td class=\"tdata\">Never<br>Sometimes<br>Often<br>Always</td>\n</tr>\n<tr>\n<td class=\"tdata arc\">12</td>\n<td class=\"tdata arc\">c88cop7</td>\n<td class=\"tdata arc\">do you feel trapped in your role as caregiver?</td>\n<td class=\"tdata arc\">1<br>2<br>3<br>4</td>\n<td class=\"tdata arc\">Never<br>Sometimes<br>Often<br>Always</td>\n</tr>\n<tr>\n<td class=\"tdata\">13</td>\n<td class=\"tdata\">c89cop8</td>\n<td class=\"tdata\">do you feel supported by friends/neighbours?</td>\n<td class=\"tdata\">1<br>2<br>3<br>4</td>\n<td class=\"tdata\">never<br>sometimes<br>often<br>always</td>\n</tr>\n<tr>\n<td class=\"tdata arc\">14</td>\n<td class=\"tdata arc\">c90cop9</td>\n<td class=\"tdata arc\">do you feel caregiving worthwhile?</td>\n<td class=\"tdata arc\">1<br>2<br>3<br>4</td>\n<td class=\"tdata arc\">never<br>sometimes<br>often<br>always</td>\n</tr>\n<tr>\n<td class=\"tdata\">15</td>\n<td class=\"tdata\">c160age</td>\n<td class=\"tdata\">carer' age</td>\n<td class=\"tdata\" colspan=\"2\"><em>range: 18-89</em></td>\n</tr>\n<tr>\n<td class=\"tdata arc\">16</td>\n<td class=\"tdata arc\">c161sex</td>\n<td class=\"tdata arc\">carer's gender</td>\n<td class=\"tdata arc\">1<br>2</td>\n<td class=\"tdata arc\">Male<br>Female</td>\n</tr>\n<tr>\n<td class=\"tdata\">17</td>\n<td class=\"tdata\">c172code</td>\n<td class=\"tdata\">carer's level of education</td>\n<td class=\"tdata\">1<br>2<br>3</td>\n<td class=\"tdata\">low level of education<br>intermediate level of education<br>high level of education</td>\n</tr>\n<tr>\n<td class=\"tdata arc\">18</td>\n<td class=\"tdata arc\">c175empl</td>\n<td class=\"tdata arc\">are you currently employed?</td>\n<td class=\"tdata arc\">0<br>1</td>\n<td class=\"tdata arc\">no<br>yes</td>\n</tr>\n<tr>\n<td class=\"tdata\">19</td>\n<td class=\"tdata\">barthtot</td>\n<td class=\"tdata\">Total score BARTHEL INDEX</td>\n<td class=\"tdata\" colspan=\"2\"><em>range: 0-100</em></td>\n</tr>\n<tr>\n<td class=\"tdata arc\">20</td>\n<td class=\"tdata arc\">neg_c_7</td>\n<td class=\"tdata arc\">Negative impact with 7 items</td>\n<td class=\"tdata arc\" colspan=\"2\"><em>range: 7-28</em></td>\n</tr>\n<tr>\n<td class=\"tdata\">21</td>\n<td class=\"tdata\">pos_v_4</td>\n<td class=\"tdata\">Positive value with 4 items</td>\n<td class=\"tdata\" colspan=\"2\"><em>range: 5-16</em></td>\n</tr>\n<tr>\n<td class=\"tdata arc\">22</td>\n<td class=\"tdata arc\">quol_5</td>\n<td class=\"tdata arc\">Quality of life 5 items</td>\n<td class=\"tdata arc\" colspan=\"2\"><em>range: 0-25</em></td>\n</tr>\n<tr>\n<td class=\"tdata\">23</td>\n<td class=\"tdata\">resttotn</td>\n<td class=\"tdata\">Job restrictions</td>\n<td class=\"tdata\" colspan=\"2\"><em>range: 0-4</em></td>\n</tr>\n<tr>\n<td class=\"tdata arc\">24</td>\n<td class=\"tdata arc\">tot_sc_e</td>\n<td class=\"tdata arc\">Services for elderly</td>\n<td class=\"tdata arc\" colspan=\"2\"><em>range: 0-9</em></td>\n</tr>\n<tr>\n<td class=\"tdata\">25</td>\n<td class=\"tdata\">n4pstu</td>\n<td class=\"tdata\">Care level</td>\n<td class=\"tdata\">0<br>1<br>2<br>3<br>4</td>\n<td class=\"tdata\">No Care Level<br>Care Level 1<br>Care Level 2<br>Care Level 3<br>Care Level 3+</td>\n</tr>\n<tr>\n<td class=\"tdata arc\">26</td>\n<td class=\"tdata arc\">nur_pst</td>\n<td class=\"tdata arc\">Care level</td>\n<td class=\"tdata arc\">1<br>2<br>3</td>\n<td class=\"tdata arc\">Care Level 1<br>Care Level 2<br>Care Level 3/3+</td>\n</tr>\n\n</table>\n</body></html>"
In general, HTML is no longer intended to be readable and understandable by anything other than a browser.
library(sjPlot)
library(rvest)
library(writexl)
data(efc)
html_content <- view_df(efc)$page.complete
# If html_content is a file, use read_html("path_to_html_file.html")
# If it's a string of HTML, use read_html(html_content)
html_data <- read_html(html_content)

# Extract tables from the HTML (assuming the data is in table format)
tables <- html_data |> html_table()
tables
write_xlsx(tables, "output.xlsx")
Thank you very much indeed, we are approaching what I want.
Yes, I agree, but when you want to prepare a report for 98% of population you must do it according to ms office or libre office etc, otherwise only 2% or less would understand how to open it in a browser and even lesser percent would know how to insert it in ms word or similar soft.
Additional question if I may: is it possible in RStudio to convert tables which is a list into a dataframe object ?
I had in mind an object "tables" (which is a list) from your kind reprex up there:
library(sjPlot)
library(rvest)
library(writexl)
data(efc)
html_content <- view_df(efc)$page.complete
# If html_content is a file, use read_html("path_to_html_file.html")
# If it's a string of HTML, use read_html(html_content)
html_data <- read_html(html_content)

# Extract tables from the HTML (assuming the data is in table format)
tables <- html_data |> html_table()
tables
write_xlsx(tables, "output.xlsx")
Notice that this data only produces the single table. I don't export to spreadsheet enough to know if multiple tables will write to different tabs. If so, you may need to write a routine to pick them from the list elements contained in tables