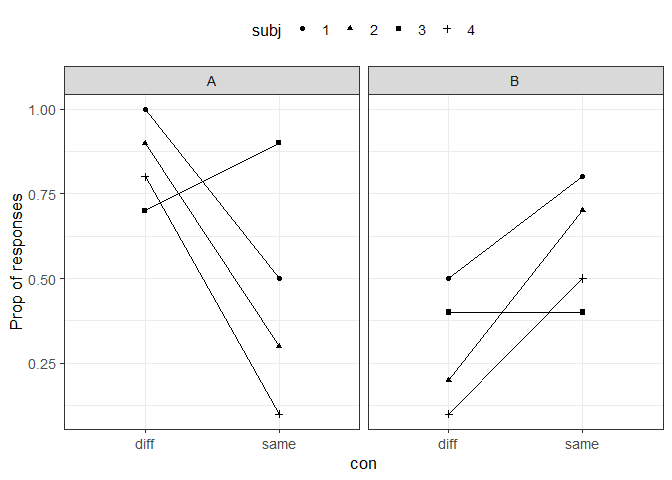
I'm plotting each subject's proportion of responses to "same" or "different" stimuli across two blocks (A block and B block), meaning that each subject has 4 data points plotted. Two for A block (same and different) and two for B block (same and different). Also meaning there are 4 rows of data containing proportion of responses for each subject.
I would like to connect each subject's "same" and
"different" data points with a line WITHIN a block (e.g. "same" and "different" data points are connected via a line within the A block and within the B block separately for each subject).
I tried using the "group = subject" that comes with geom_line(), but it connects ALL of the subject's data points when I would like to only connect data points within blocks.
testplot <- ggplot(df, aes(x=block, y=prop, shape=con colour=con)) +
  geom_point(position=position_dodge(width=.1)) +
  xlab("Block") + ylab("Prop of responses") +
  theme_bw(base_size = 13) +
  theme(legend.position="top")
plot(testplot)
sample dataset:
subj = c(1, 1, 2, 2, 3, 3, 4, 4, 1, 1, 2, 2, 3, 3, 4, 4)
prop = c(0.5, 0.8, 0.3, 0.7, 0.9, 0.4, 0.1, 0.5, 1, 0.5, 0.9, 0.2, 0.7, 0.4, 0.8, 0.1)
con = c("same", "same", "same", "same", "same", "same", "same", "same", "diff", "diff", "diff", "diff", "diff", "diff", "diff", "diff")
block = c("A", "B", "A", "B", "A", "B", "A", "B", "A", "B", "A", "B", "A", "B", "A", "B")

df = data.frame(subj, prop, con, block)
Any help is appreciated!