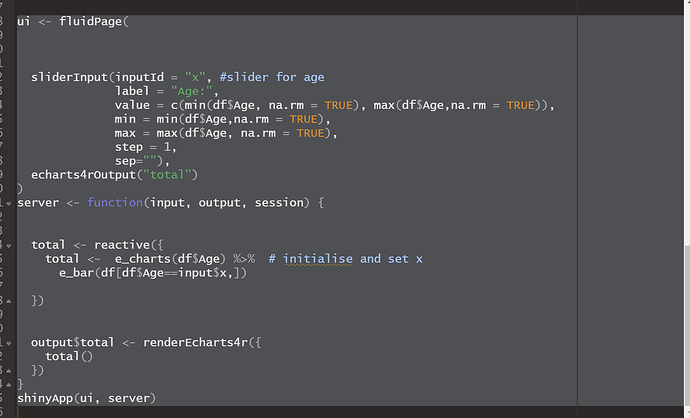
...This is my code...
ui <- fluidPage(
sliderInput(inputId = "x", slider for age
label = "Age:",
value = c(min(df$Age, na.rm = TRUE), max(df$Age,na.rm = TRUE)),
min = min(df$Age,na.rm = TRUE),
max = max(df$Age, na.rm = TRUE),
step = 1,
sep=""),
echarts4rOutput("total")
)
server <- function(input, output, session) {
total <- reactive({
total <- e_charts(df$Age) %>% # initialise and set x
e_bar(df[df$Age==input$x,])
})
output$total <- renderEcharts4r({
total()
})
}
shinyApp(ui, server)
The image is below. Can anyone help me with this?
I am trying to get a slider that filters age using echarts4r
