am really having trouble with someone on rStudio and thought people here might know how to help.
I am conducting a network analysis using the EBIC Glasso function, examining clinical symptoms and dimensions of insight in schizophrenia. I am at the step where I am trying to compute centrality stability for the Network using the bootnet function, however, when I go to do this, only the measure "strength" appears, when normally, betweenness and closeness should also appear. I even included the bootnet "statistics" argument, yet still only strength appeared. Does anyone know what is wrong here and how I can fix this?
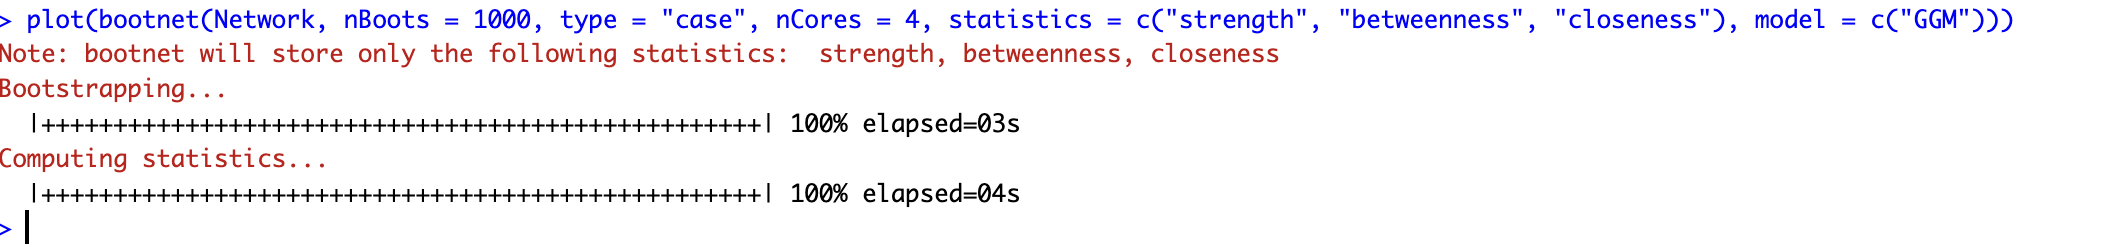
I tried :plot(bootnet(Network, nBoots = 1000, type = "case", nCores = 4, statistics = c("strength", "betweenness", "closeness"))). It plotted the correct idea of a graph, but only showed the strength line and not closeness or betweenness.