Hi,
I'm working on a shiny app which uses ggiraph. I'm trying to combine two donut plots (actually bar plots with polar coordinates). This is my code, which uses plot_grid to combine two ggplots using a personal function grafico_donut which uses geom_bar_interactive.
ggiraph(ggobj = plot_grid(
grafico_donut(filter(cuotas_prueba,GRUPO_CUOTA == "GAL_PREMIUM"), tamano = 10, unidad = "Gl "),
grafico_donut(filter(cuotas_prueba,GRUPO_CUOTA == "GAL_SATINADO"), tamano = 10, unidad = "Gl ")))
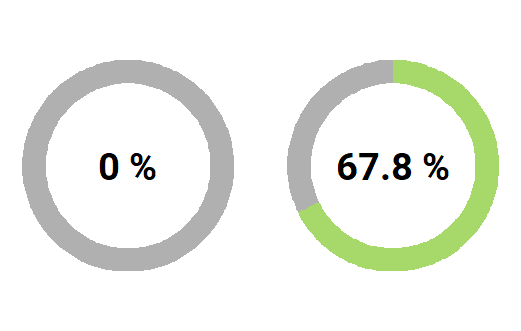
When I use only plot_grid I get the following image:
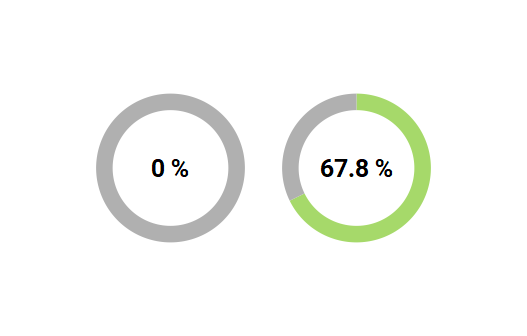
But after using ggirpah I get this:
Then later I'm using ggiraphOutput for a shiny app.
I haven't found anything around this topic, but changing width and size parameters in ggiraphOutput has no effect.