Here i tried to combine 2 html world maps as plots but they are combined within 2 rows and the size i.e., height of the plots is reduced, but since i am combining them as html i expect that the we can scroll the html so the plots should be displayed with full width and height as they appear as original.
the gplot1 and gplot2 are 2 ggplotly graphs
gplot1 <- ggplotly(gplot, tooltip = "text")
gplot2 <- ggplotly(gplot, tooltip = "text")
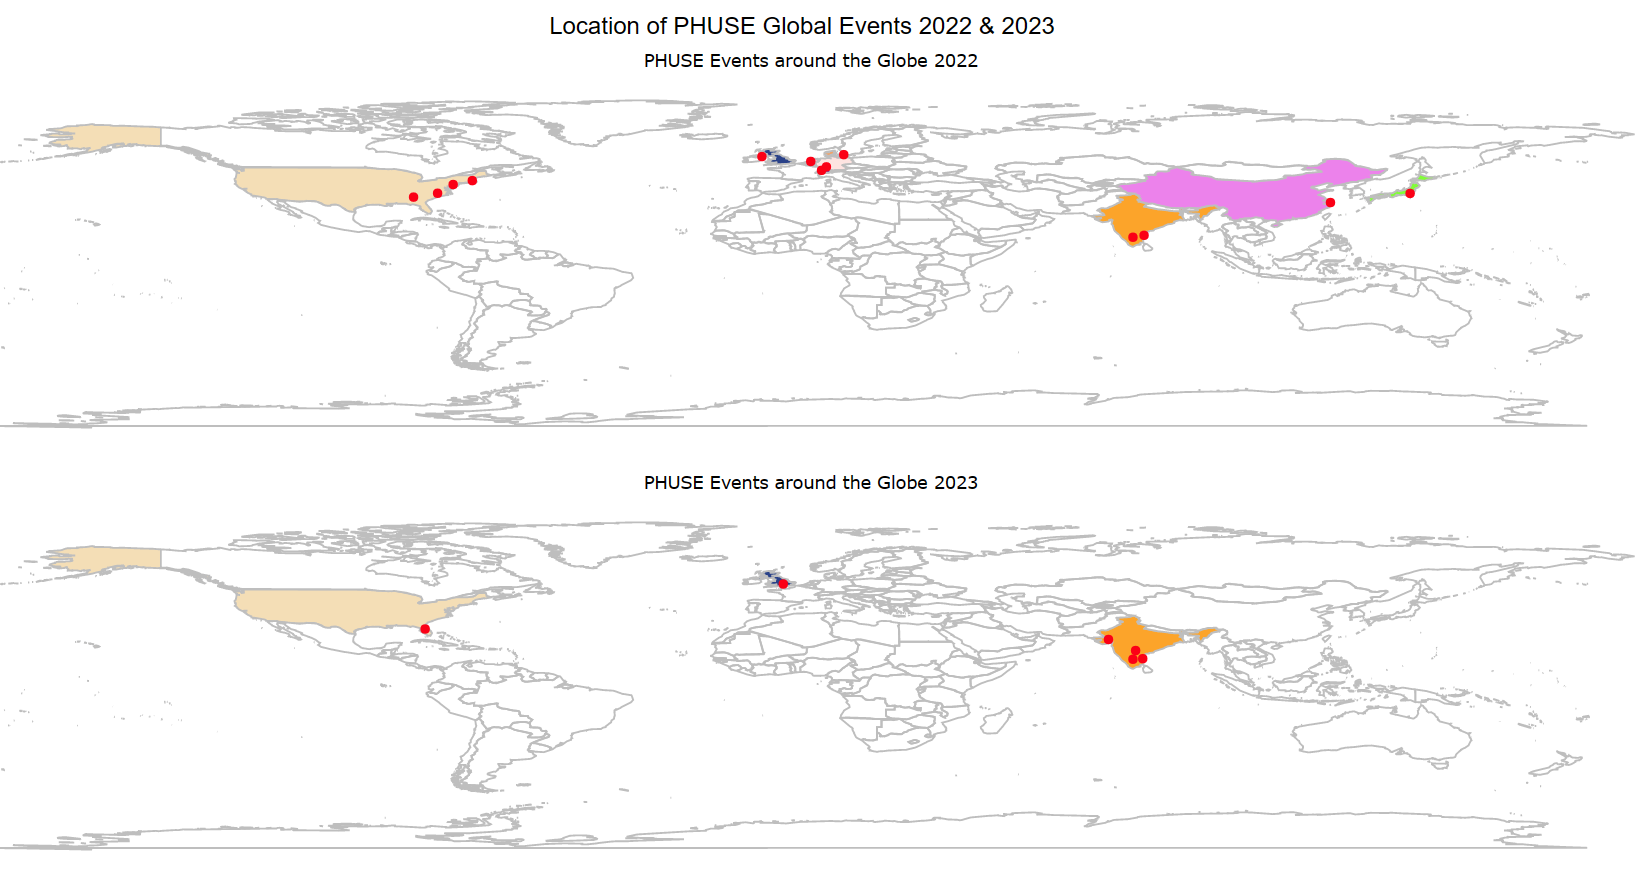
manipulateWidget::combineWidgets(title = "Location of PHUSE Global Events 2022 & 2023",
gplot1, gplot2,
byrow = T
)
The single html appears as below

whereas the 2 html combined with htmlwidget appears as below