library(ggplot2)
tektel <- read.csv("Satutahun.csv")
View(tektel)
plot.daya <- ggplot(data=tektel,
aes(x = Tanggal, y=Daya, group = 1, sep =","))+
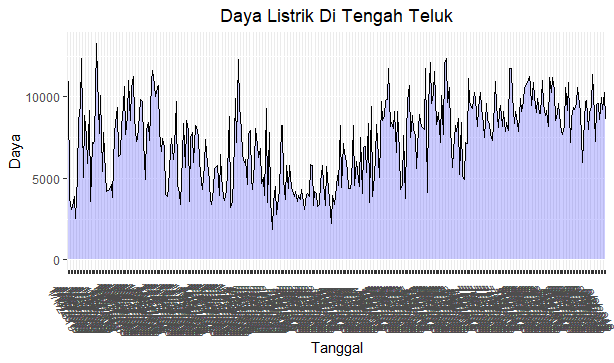
ggtitle ("Daya Listrik Di Tengah Teluk")+
theme(plot.title = element_text(hjust = 0.5), axis.text.x = element_text(angle = 300))
plot.daya + geom_line() + geom_area(colour="black", fill="blue", alpha=.2)
i don't understand how to change the angle of my x label and they can't to be see. Please help me to change the angle from my xlabel so they can to see