Hi everyone,
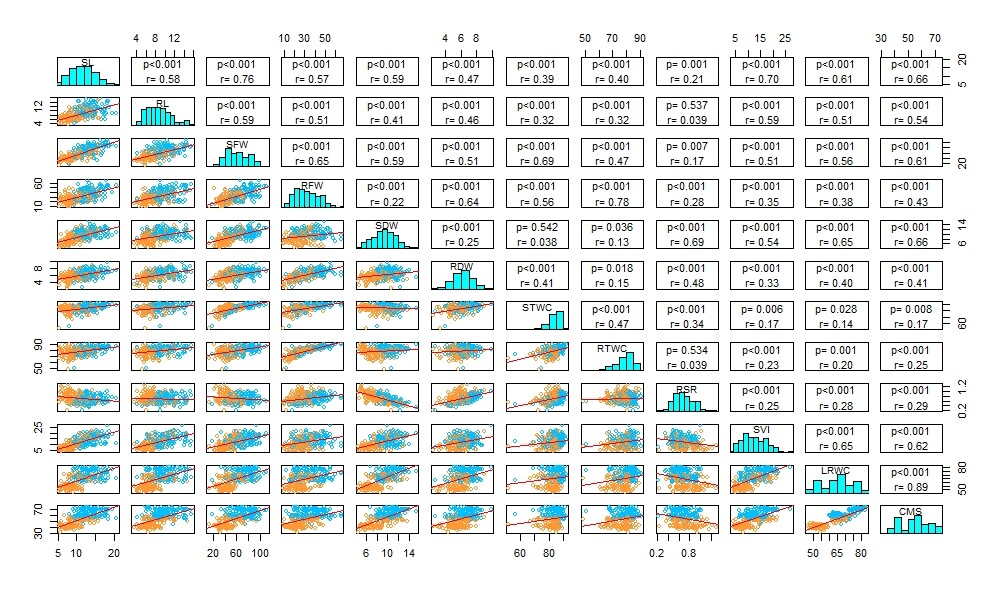
I prepared the following scatter plot using the codes below-
df <- Box[1:254, 2:13]
panel.cor <- function(x, y, digits=2, prefix="", cex.cor, ...)
{
usr <- par("usr"); on.exit(par(usr))
par(usr = c(0, 1, 0, 1))
r <- abs(cor(x, y, use="complete.obs"))
txt <- format(c(r, 0.123456789), digits=digits)[1]
test <- cor.test(x,y)
Signif <- ifelse(round(test$p.value,3)<0.001,"p<0.001",paste("p=",round(test$p.value,3)))
text(0.5, 0.25, paste("r=",txt))
text(.5, .75, Signif)
}
panel.hist <- function(x, ...)
{
usr <- par("usr"); on.exit(par(usr))
par(usr = c(usr[1:2], 0, 1.5) )
h <- hist(x, plot = FALSE)
breaks <- h$breaks; nB <- length(breaks)
y <- h$counts; y <- y/max(y)
rect(breaks[-nB], 0, breaks[-1], y, col="cyan", ...)
}
panel<-function(x,y, col=c("#00BFFF", "#FF9933"), cex = 0.8, pch = par("pch"), span = 2/3, iter = 3, ...)
{
points(x,y, col=col, cex=cex, pch=pch)
abline(lm(y~x), col='red')
}
pairs(df,
lower.panel=panel, upper.panel=panel.cor,diag.panel=panel.hist)
And this is my sample data-
| Treatment | SL | RL | SFW | RFW | SDW | RDW | STWC | RTWC | RSR | SVI | LRWC | CMS |
|---|---|---|---|---|---|---|---|---|---|---|---|---|
| Control | 14.43 | 14.01 | 69.57 | 36.84 | 11.58 | 8.59 | 83.36 | 76.68 | 0.74 | 9.39 | 62.8 | 55.6 |
| PEG (25%) | 6.97 | 7.34 | 31.86 | 26.44 | 8.08 | 6.99 | 74.64 | 73.56 | 0.87 | 4.82 | 50.3 | 39.3 |
| Control | 12.92 | 8.96 | 65.33 | 65.59 | 7.77 | 6.12 | 88.10 | 90.67 | 0.79 | 8.09 | 71.7 | 57.8 |
| PEG (25%) | 8.11 | 5.86 | 21.90 | 48.34 | 4.81 | 5.24 | 78.05 | 89.16 | 1.09 | 5.09 | 58.4 | 43.6 |
| Control | 17.85 | 8.88 | 98.37 | 65.39 | 9.44 | 6.82 | 90.40 | 89.56 | 0.72 | 11.13 | 74.1 | 62.1 |
| PEG (25%) | 9.26 | 5.38 | 41.11 | 46.39 | 5.81 | 5.84 | 85.87 | 87.42 | 1.00 | 6.09 | 54.2 | 44.8 |
| Control | 11.94 | 9.91 | 68.06 | 37.37 | 7.88 | 7.04 | 88.43 | 81.17 | 0.89 | 7.20 | 68.4 | 60.0 |
| PEG (25%) | 7.71 | 5.80 | 35.56 | 22.59 | 5.52 | 5.84 | 84.47 | 74.14 | 1.06 | 4.54 | 54.2 | 41.9 |
| Control | 13.12 | 9.89 | 93.54 | 49.99 | 9.73 | 7.60 | 89.60 | 84.79 | 0.78 | 14.79 | 75.4 | 65.7 |
| PEG (25%) | 12.39 | 6.95 | 64.27 | 39.55 | 8.34 | 6.83 | 87.02 | 82.73 | 0.82 | 12.43 | 67.4 | 51.5 |
| Control | 13.79 | 8.80 | 75.82 | 46.65 | 8.34 | 7.49 | 89.01 | 83.95 | 0.90 | 15.72 | 63.8 | 57.3 |
| PEG (25%) | 7.89 | 5.56 | 39.51 | 36.36 | 5.27 | 6.79 | 86.65 | 81.33 | 1.29 | 9.33 | 51.6 | 39.8 |
| Control | 11.53 | 10.46 | 74.57 | 46.91 | 9.30 | 6.87 | 87.53 | 85.35 | 0.74 | 7.40 | 71.6 | 60.0 |
| PEG (25%) | 7.65 | 6.81 | 37.25 | 28.88 | 6.43 | 5.86 | 82.74 | 79.71 | 0.91 | 4.78 | 59.3 | 40.5 |
| Control | 16.26 | 15.57 | 83.83 | 57.73 | 8.11 | 6.89 | 90.32 | 88.07 | 0.85 | 12.53 | 67.3 | 62.1 |
| PEG (25%) | 7.01 | 7.53 | 40.61 | 44.63 | 5.10 | 5.77 | 87.44 | 87.07 | 1.13 | 5.74 | 54.9 | 45.0 |
| Control | 13.63 | 8.51 | 93.31 | 33.72 | 9.16 | 7.28 | 90.18 | 78.42 | 0.79 | 10.18 | 73.2 | 52.8 |
| PEG (25%) | 6.61 | 4.96 | 43.24 | 18.41 | 6.38 | 5.65 | 85.25 | 69.33 | 0.89 | 5.27 | 56.8 | 38.9 |
| Control | 15.81 | 11.54 | 88.62 | 49.47 | 9.81 | 6.42 | 88.93 | 87.02 | 0.65 | 21.07 | 77.8 | 72.4 |
I need some changes in the plot-
- Want to add two smooth lines for two treatments/levels in each box of the lower panel,
- In the upper panel, I want add two r values for two treatment/levels in each box,
- Want to add significance level by asterisk mark with r values instead of text.
- Text size sufficiently bigger so that it can be easily understood.
- If possible, a curve to add with the histogram in the diagonal panel.
If someone here rewrite/amend the provided code using my sample data, I will be grateful.
Thanks everyone