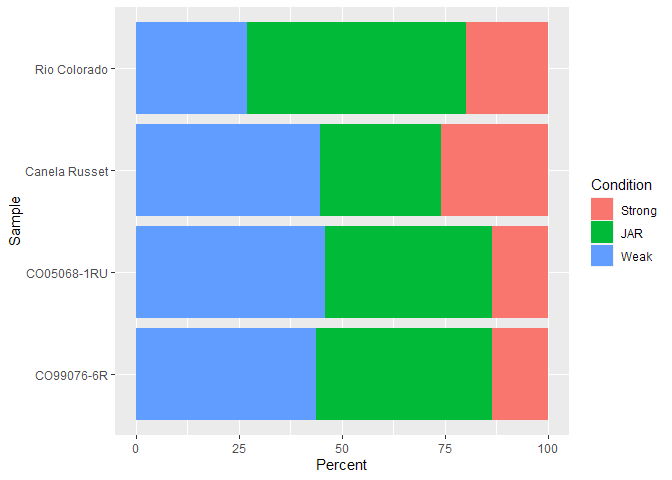
Hello, I was trying to change the order of bars but somehow it is not working. Can someone please help me solve this?
#JAR plot
library(ggplot2)
library(dplyr)
#> Warning: package 'dplyr' was built under R version 4.0.2
#>
#> Attaching package: 'dplyr'
#> The following objects are masked from 'package:stats':
#>
#>     filter, lag
#> The following objects are masked from 'package:base':
#>
#>     intersect, setdiff, setequal, union
library(forcats)
df <- read.csv("F:/Chapter6_Files_Figures/jar_file.csv")
colnames(df)[1] = "Sample"
df$Condition <- factor(df$Condition, levels = c("Strong", "JAR", "Weak"))
ggplot(df, aes(y = reorder(Sample, order = c("Russian Banana", "Vermillion", "Atlantic", "POR12PG28-3", "Valery", "Rio Colorado",
                                             "CO99076-6R", "Purple Majesty", "AC99330-1PY", "CO05068-1RU", "Masquerade", "Canela Russet")),
               x = Percent, fill = Condition)) +
  theme(legend.title = element_blank()) +
  geom_bar(stat="identity") +
  geom_text(aes(x = Percent, label = paste0(round(Percent, .02),"%")),
                                        position = position_stack(vjust = 0.5), size = 3) +
  scale_fill_manual(values = c("#CCCCCC", "#669999", "#FFFFFF")) +
  theme(axis.title.x=element_blank(), axis.title.y = element_blank(),
        axis.text.y = element_text(face = "bold"))
#> Error in tapply(X = X, INDEX = x, FUN = FUN, ...): argument "X" is missing, with no default

Created on 2020-09-25 by the reprex package (v0.3.0)
Data:
squads <- tibble::tribble(
             ~Sample.name,    ~Percent, ~Condition,
            "CO05068-1RU", 45.83333333,     "Weak",
            "CO05068-1RU",      40.625,      "JAR",
            "CO05068-1RU", 13.54166667,   "Strong",
          "Canela Russet", 44.79166667,     "Weak",
          "Canela Russet", 29.16666667,      "JAR",
          "Canela Russet", 26.04166667,   "Strong",
             "CO99076-6R",       43.75,     "Weak",
             "CO99076-6R", 42.70833333,      "JAR",
             "CO99076-6R", 13.54166667,   "Strong",
           "Rio Colorado", 27.08333333,     "Weak",
           "Rio Colorado",      53.125,      "JAR",
           "Rio Colorado", 19.79166667,   "Strong",
           "AC99330-1P/Y", 39.58333333,     "Weak",
           "AC99330-1P/Y", 44.79166667,      "JAR",
           "AC99330-1P/Y",      15.625,   "Strong",
             "Masquerade", 30.20833333,     "Weak",
             "Masquerade", 57.29166667,      "JAR",
             "Masquerade",        12.5,   "Strong",
         "Russian Banana", 42.70833333,     "Weak",
         "Russian Banana", 20.83333333,      "JAR",
         "Russian Banana", 36.45833333,   "Strong",
            "POR12PG28-3", 39.58333333,     "Weak",
            "POR12PG28-3", 39.58333333,      "JAR",
            "POR12PG28-3", 20.83333333,   "Strong",
             "Vermillion",      34.375,     "Weak",
             "Vermillion", 45.83333333,      "JAR",
             "Vermillion", 19.79166667,   "Strong",
                 "Valery",      40.625,     "Weak",
                 "Valery", 35.41666667,      "JAR",
                 "Valery", 23.95833333,   "Strong"
         )
head(squads)
#> # A tibble: 6 x 3
#>   Sample.name   Percent Condition
#>   <chr>           <dbl> <chr>
#> 1 CO05068-1RU      45.8 Weak
#> 2 CO05068-1RU      40.6 JAR
#> 3 CO05068-1RU      13.5 Strong
#> 4 Canela Russet    44.8 Weak
#> 5 Canela Russet    29.2 JAR
#> 6 Canela Russet    26.0 Strong
Created on 2020-09-25 by the reprex package (v0.3.0)