What data are you using?

The first 20 rows of data looks like:
'''
structure(list(flav = c("c", "v", "c", "c", "v", "v", "c", "v", "c", "c"), top = c("c", "s", "n", "s", "c", "c", "n", "n", "c", "c"), syr = c(TRUE, FALSE, TRUE, TRUE, FALSE, FALSE, TRUE, FALSE, TRUE, TRUE), weight = c(13.1, 14.4, 11.4, 8.7, 6.2, 12.6, 5.1, 12.8, 10.9, 6.5), cal = c(1293.1, 1460.5, 1202.2, 844.4, 552.9, 1259.4, 520.6, 1308.1, 1084.5, 649.8)), row.names = c(NA, 10L ), class = "data.frame")
'''
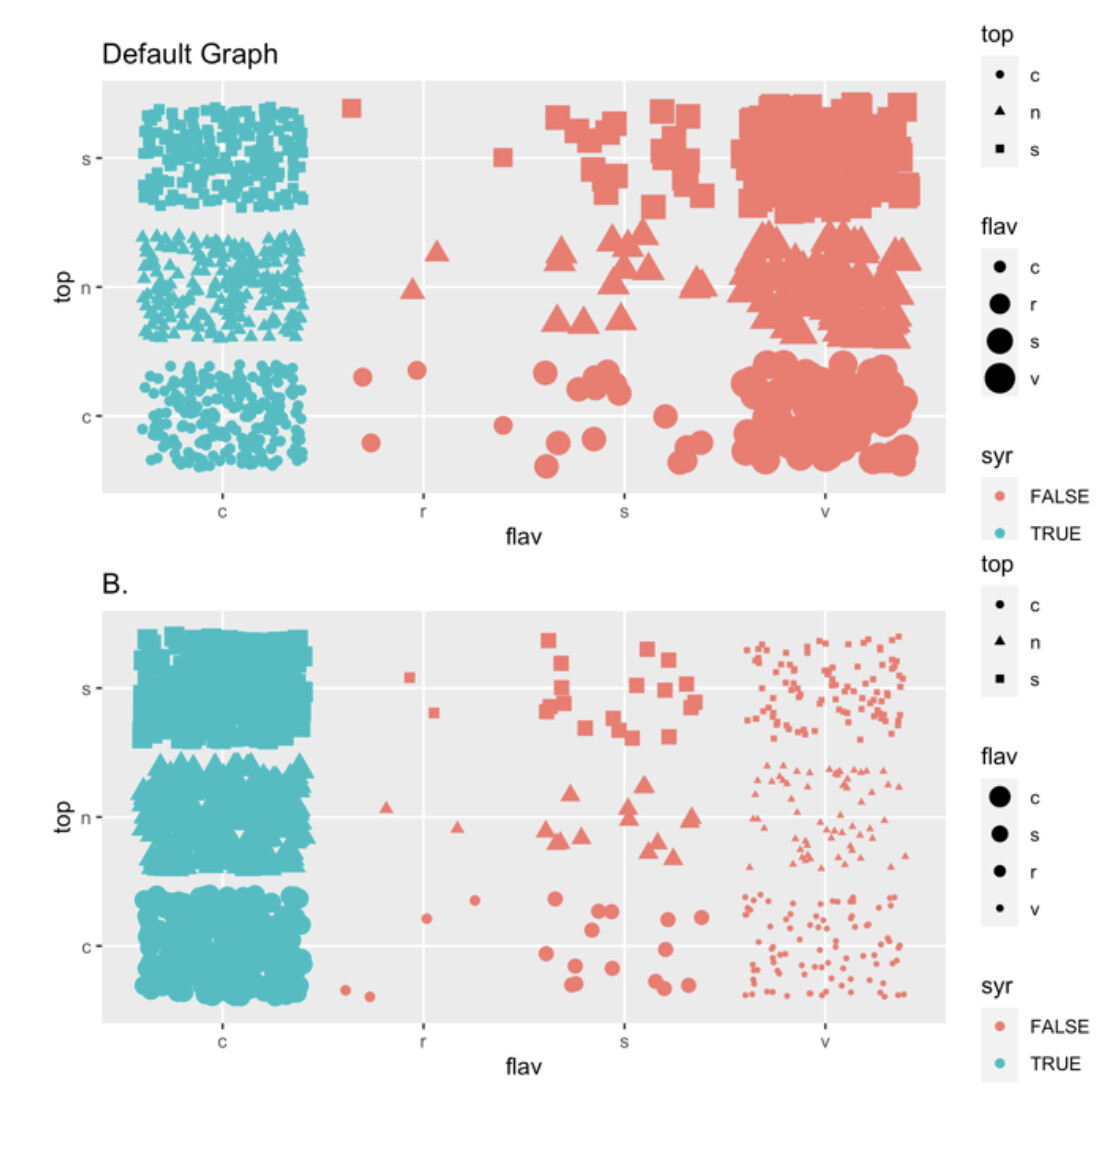
Is there a reason why in B the order of the flavors on the x-axis is different than in the legend? And would you want to keep them having the different orders shown in B?