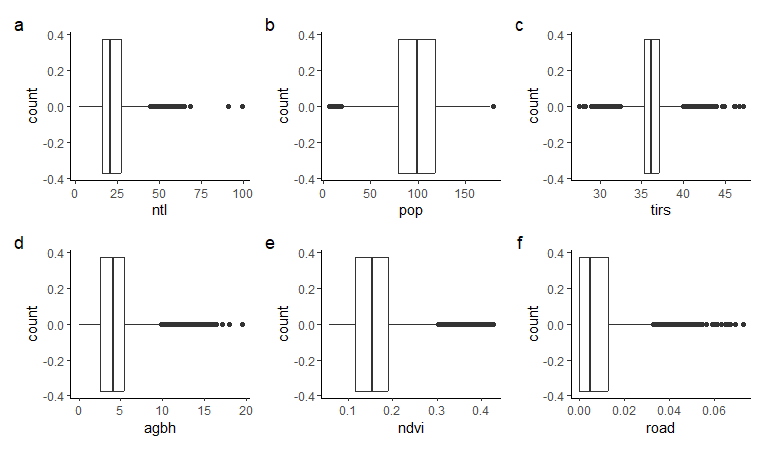
I have created a grid plot and as you can see in the image below the a, b, c, d, e, f letters (highlighted in red circle) are bold. I would like to change them in plain.
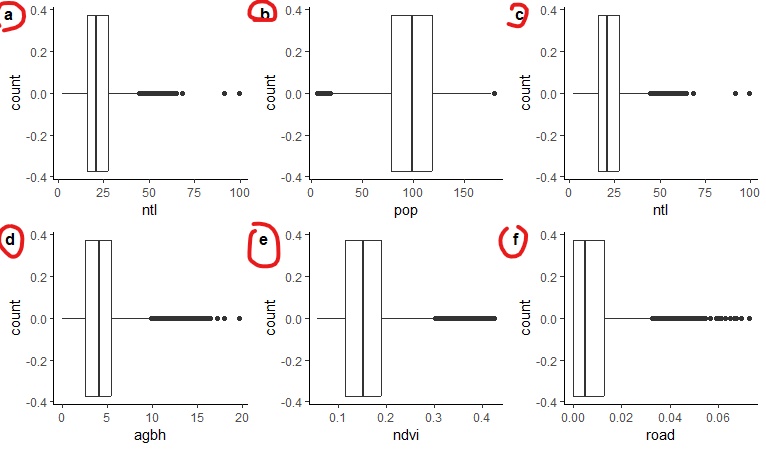
I have tried a solution like this one using the draw_label function, but I couldn't fix the issue.
Here is the code:
library(ggplot2)
library(cowplot)
library(gridExtra)

b1 = ggplot(block.data, aes(x = block.data$ntl)) +
  geom_boxplot() +

b2 = ggplot(block.data, aes(x = pop)) +
  geom_boxplot()

plot_grid(b1, b2,
          labels = "auto",
          label_size = 12)
Here is a small dataset:
block.data = structure(list(ntl = c(4.68654727935791, 8.53302478790283, 4.18557691574097,
9.23678398132324, 4.20125484466553), pop = c(47.0656356811523,
73.5098342895508, 7.41780138015747, 108.991493225098, 12.1673622131348
)), class = "data.frame", row.names = c(NA, -5L))