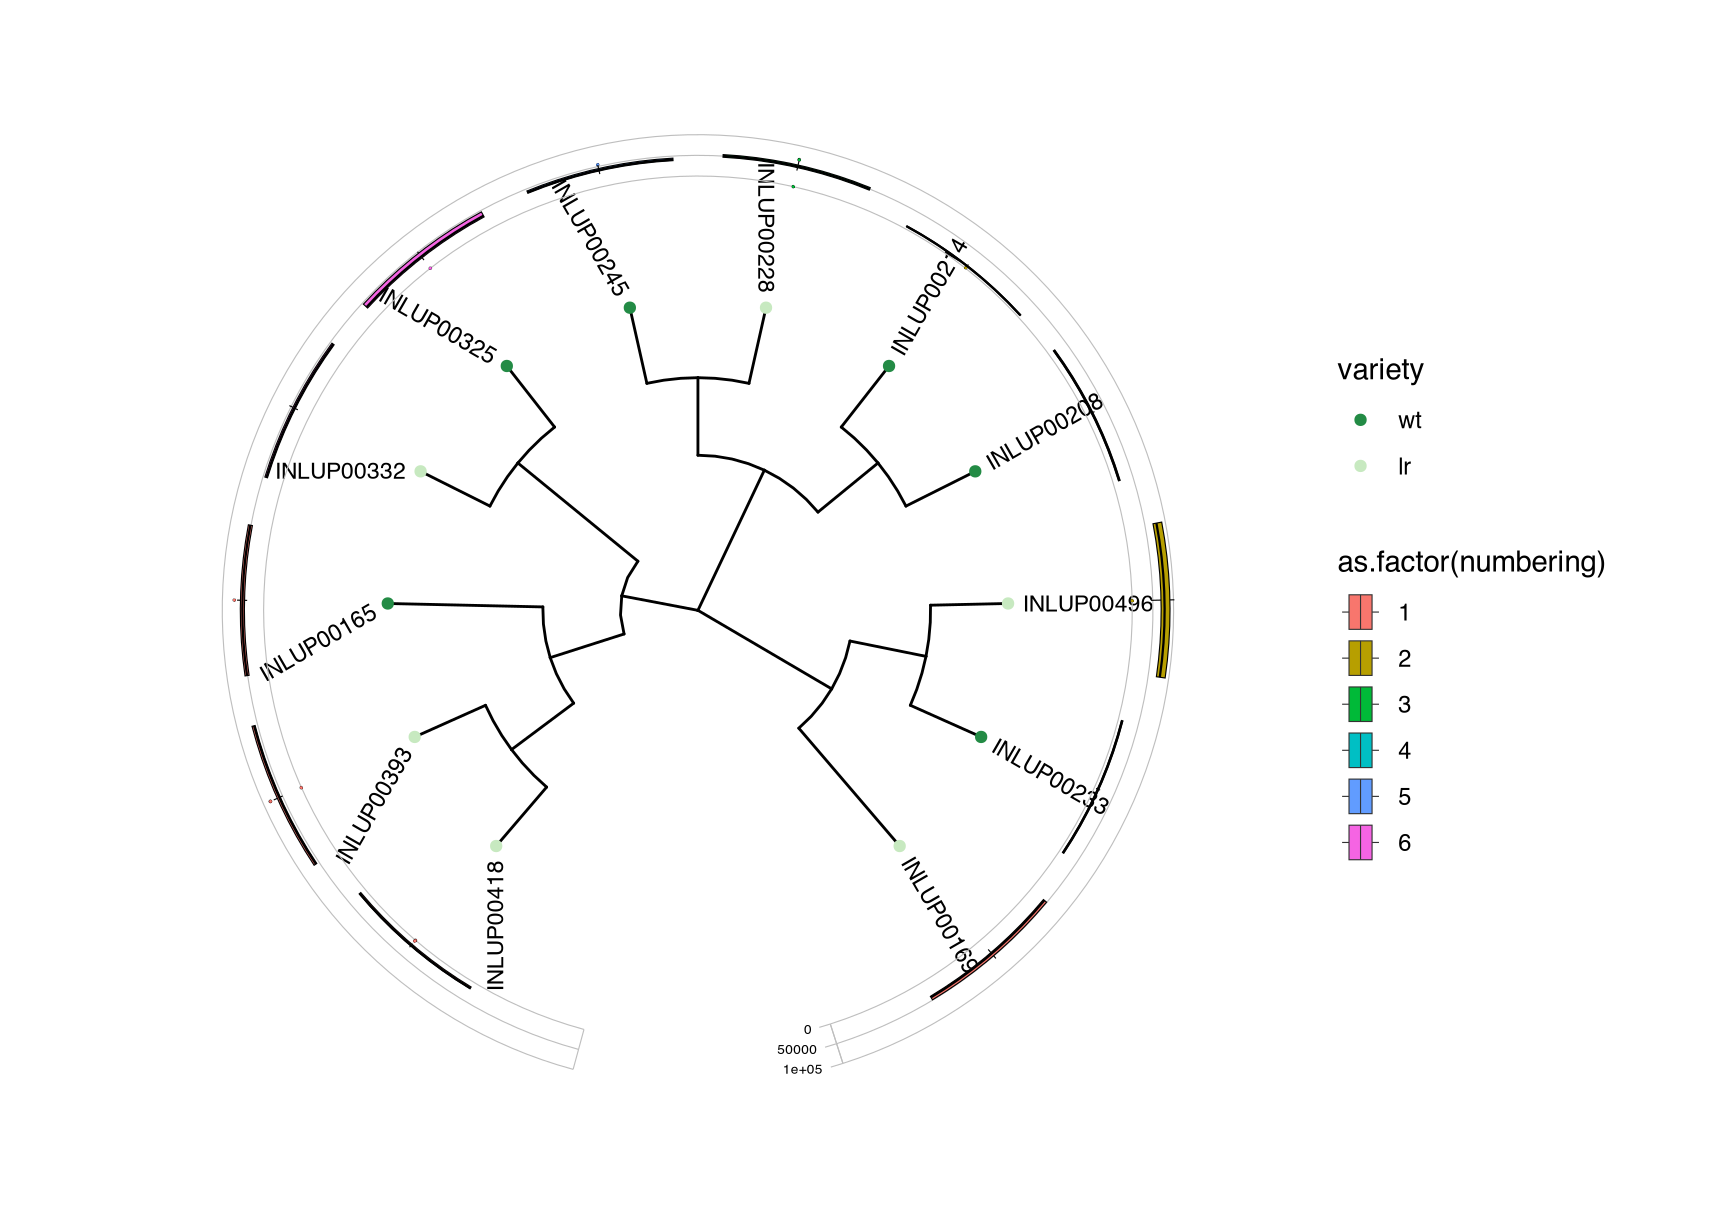
Hi there, I was working on a ggtree plot and added some extra features with geom_fruit. I managed to get my box-plots wrapping around the tree (see image); however, for some reason, I cannot manage to change the name of the legend, its labels, colors, and overall features — as per the scale_fill_manual I set for the tree plot.
For reference, I'm following this guide which might help in finding the problem. I tried few things but nothing worked out well... below the code I'm using and a dput of relevant data. Thanks in advance!
library(ape)
library(dplyr)
library(tibble)
library(treeio)
library(janitor)
library(ggtree)
library(ggplot2)
library(tidytree)
library(phytools)
library(phangorn)
library(phylobase)
library(ggtreeExtra)
library(RColorBrewer)

###LOAD DATA AND WRANGLING
ibs_matrix = read.delim("/path/to/phylo_tree_header.phy", sep="\t", header=TRUE)
colnames(ibs_matrix)[1] <- ""
ibs_matrix[1] <- NULL
box_plot = read.delim("/path/to/box_plot.txt", sep="\t", header=FALSE)
box_plot[1,1] <- "id"

ibs_matrix_t <- t(ibs_matrix)
box_plot_t <- t(box_plot); box_plot_t <- janitor::row_to_names(box_plot_t, 1)
#ibs_matrix_t

###ADD META INFO AND DF FORMATTING
variety <- c("wt", "lr", "wt", "wt", "lr", "wt", "wt", "wt", "lr", "lr", "lr", "lr")
location <- c("ESP", "ESP", "ITA", "ITA", "JOR", "TUR", "PAL", "GRC", "GRC", "ESP", "ESP", "ITA")

meta_df <- data.frame(ibs_matrix_t[, 1], variety, location); meta_df <- meta_df[ -c(1) ]
meta_df$id <- rownames(meta_df); meta_df <- meta_df[,c(3,1,2)]
rownames(meta_df) <- NULL

###COMPUTE AND CALCULATE PIRWISE DISTANCES, PLUS CONVERSION TO PHYLO
pdist <- dist(ibs_matrix_t, method="euclidean", diag=TRUE, upper=TRUE, p=2)
distances <- distanceHadamard(as.matrix(pdist))

phylo <- as.phylo(distances)

###GGTREE PERSONALIZATION
meta_df$variety <- factor(meta_df$variety, levels=c('wt', 'lr'))
t1 <- ggtree(phylo, branch.length='none', layout='circular') %<+% meta_df +
geom_tippoint(aes(color=variety)) + geom_tiplab(size=3, hjust=-.1) +
scale_color_manual(values=brewer.pal(9, "Greens")[c(7, 3)])
t1

box_plot <- janitor::row_to_names(box_plot, 1); box_plot=subset(box_plot, select=-c(id))
box_plot_t <- data.frame(values=matrix(t(box_plot)),
                         id=colnames(box_plot)); box_plot_t <- box_plot_t[order(box_plot_t[["id"]]),]
box_plot_t <- full_join(box_plot_t, meta_df, by="id")
get_category <- function(location) {
  if (location == "ESP") {
    return(1)
  } else if (location == "ITA") {
    return(2)
  } else if (location == "JOR"){
    return(3)
  } else if (location == "TUR") {
    return(4)
  } else if (location == "PAL"){
    return(5)
  } else if (location == "GRC") {
    return(6)
  }
}
box_plot_t <- box_plot_t %>%
  mutate(numbering = sapply(location, get_category))
box_plot_t

t1_box <- t1 +
  geom_fruit(
    data=box_plot_t, geom=geom_boxplot,
    mapping = aes(
      y=id,
      x=as.numeric(as.character(values)),
      fill=as.factor(numbering)
    ),
    offset=.4, size=.2, outlier.size=.5, outlier.stroke=.08, outlier.shape=21,
    axis.params = list(
      axis="x",
      text.size=1.8,
      hjust=1,
      vjust=0.5,
      nbreak=3
    ),
    grid.params=list()
  )

t1_box <- rotate_tree(t1_box, -90)
t1_box +
  scale_fill_manual(
    name="location",
    values=brewer.pal(11, "RdYlGn"),
    labels=c("ESP", "ITA", "JOR", "TUR", "PAL", "GRC"),
    guide=guide_legend(keywidth=1, keyheight=0.8, ncol=1)
  )
t1_box
dput ibs_matrix
structure(list(INLUP00165 = c(1.53578, -0.105267, -0.0945413,
-0.083604, -0.209443, -0.139285, -0.208677, -0.199941, -0.209932,
-0.130887, -0.082297, -0.0719018), INLUP00169 = c(-0.105267,
1.60124, -0.142996, -0.023115, -0.243876, -0.0435319, -0.243711,
-0.256835, -0.255688, -0.132416, -0.102566, -0.0512363), INLUP00208 = c(-0.0945413,
-0.142996, 1.70865, -0.00168153, -0.229154, -0.0920099, -0.201994,
-0.278662, -0.210596, -0.190707, -0.164444, -0.101866), INLUP00214 = c(-0.083604,
-0.023115, -0.00168153, 1.36444, -0.176534, -0.0313074, -0.178905,
-0.256911, -0.220043, -0.199516, -0.16628, -0.0265423), INLUP00228 = c(-0.209443,
-0.243876, -0.229154, -0.176534, 1.66881, -0.223521, 0.672806,
-0.346079, -0.25505, -0.243328, -0.219959, -0.194674), INLUP00233 = c(-0.139285,
-0.0435319, -0.0920099, -0.0313074, -0.223521, 1.6054, -0.209163,
-0.304027, -0.216554, -0.225491, -0.186448, 0.0659375), INLUP00245 = c(-0.208677,
-0.243711, -0.201994, -0.178905, 0.672806, -0.209163, 1.63191,
-0.329851, -0.252808, -0.252563, -0.233733, -0.193315), INLUP00325 = c(-0.199941,
-0.256835, -0.278662, -0.256911, -0.346079, -0.304027, -0.329851,
2.72659, -0.253858, -0.0673777, -0.158547, -0.274507), INLUP00332 = c(-0.209932,
-0.255688, -0.210596, -0.220043, -0.25505, -0.216554, -0.252808,
-0.253858, 2.45426, -0.233602, -0.159556, -0.186578), INLUP00393 = c(-0.130887,
-0.132416, -0.190707, -0.199516, -0.243328, -0.225491, -0.252563,
-0.0673777, -0.233602, 1.91195, -0.0165982, -0.219464), INLUP00418 = c(-0.082297,
-0.102566, -0.164444, -0.16628, -0.219959, -0.186448, -0.233733,
-0.158547, -0.159556, -0.0165982, 1.64659, -0.156163), INLUP00496 = c(-0.0719018,
-0.0512363, -0.101866, -0.0265423, -0.194674, 0.0659375, -0.193315,
-0.274507, -0.186578, -0.219464, -0.156163, 1.41031)), row.names = c(NA,
-12L), class = "data.frame")
dput box_plot
structure(list(INLUP00165 = c("71247", "46097", "64492", "56344",
"45840", "55882", "53758", "54010", "46585", "48590", "56855",
"60986", "52021", "51466", "63630", "40707", "39995", "45744",
"50270", "51680", "46447", "44447", "58687", "51386", "48827"
), INLUP00169 = c("52201", "41279", "54405", "42242", "44539",
"53794", "42223", "34697", "34368", "29109", "39310", "51673",
"40718", "34476", "41809", "36536", "39560", "43025", "46098",
"53332", "37042", "49219", "57686", "41765", "42885"), INLUP00208 = c("16628",
"12529", "22011", "15841", "14072", "19491", "13796", "17956",
"12269", "19643", "17267", "14894", "17428", "21028", "14427",
"12621", "12243", "13858", "14986", "17584", "16875", "12470",
"22386", "20701", "14384"), INLUP00214 = c("6491", "5005", "9796",
"5728", "4567", "6823", "6793", "6042", "4116", "8757", "6534",
"7075", "6861", "11437", "8627", "5811", "5040", "5795", "7812",
"8108", "4953", "8151", "11226", "6558", "1493"), INLUP00228 = c("66954",
"49763", "61616", "53745", "47684", "52729", "51194", "53530",
"46432", "52910", "50143", "50145", "47138", "51653", "62836",
"39766", "45045", "48115", "15", "53038", "54870", "49241", "41094",
"66164", "43308"), INLUP00233 = c("10543", "7371", "12433", "4465",
"8059", "9989", "12389", "10893", "4609", "11799", "10143", "9525",
"7503", "13011", "9711", "7854", "7143", "9792", "7914", "11623",
"11173", "9082", "13972", "15058", "8268"), INLUP00245 = c("52870",
"38910", "51872", "43726", "37511", "45524", "41920", "42543",
"37332", "44934", "42060", "41015", "39371", "38787", "54069",
"31060", "37420", "42669", "41404", "49921", "40529", "33367",
"53711", "38905", "40467"), INLUP00325 = c("47797", "30812",
"48732", "32561", "29759", "46370", "34187", "36516", "32158",
"36628", "35471", "43933", "36857", "35275", "50396", "25007",
"30359", "38817", "18", "33558", "48311", "35956", "35634", "48511",
"47230"), INLUP00332 = c("52227", "40933", "50193", "43050",
"33053", "48781", "40596", "37521", "34667", "52567", "41589",
"39315", "45442", "43160", "54746", "31881", "35051", "38912",
"39364", "48679", "40634", "42024", "45438", "38130", "43506"
), INLUP00393 = c("82244", "61652", "73363", "58533", "58709",
"68165", "61546", "65897", "51179", "63922", "59164", "54743",
"57061", "81867", "49679", "53079", "60428", "314", "57889",
"63260", "56838", "56178", "68247", "50214", "56837"), INLUP00418 = c("16513",
"14388", "20001", "16319", "10966", "19256", "13421", "16286",
"11389", "18051", "12827", "17798", "17970", "19369", "12898",
"11340", "14178", "174", "18573", "14752", "17577", "20905",
"21986", "13596", "2354"), INLUP00496 = c("98447", "92995", "94249",
"88604", "58761", "91335", "79049", "81218", "74616", "90049",
"78279", "95932", "74531", "69362", "100019", "69923", "75383",
"57086", "32", "80715", "102201", "71007", "77709", "55065",
"45288")), row.names = 2:26, class = "data.frame")