I am using Leaflet package to plot latitude and longitude as a square.
Also, plotting polylines which are passing these squares.
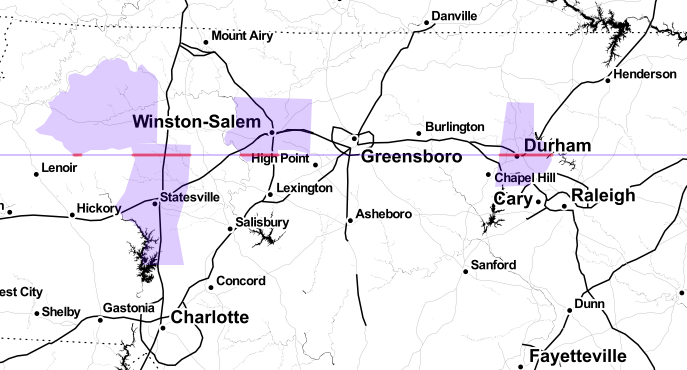
My concern is how can I change the color of the polyline when it passes through any square.

Color change is needed also, additional thickness change is appreciated.
Code somewhat looks like:-
library(leaflet)
library(sp)
library(sf)

polygon1_data1 = subset(polygon_dataset,polygon_type==1)
polygon1 <- st_as_sf(polygon1_data1 coords = c("LONGITUDE", "LATITUDE"))
polygon1 <- st_buffer(polygon1, dist = 1.25, endCapStyle = "SQUARE")
polygon1 <- st_union(polygon1)

#### Same for polygon 2,3,4,5,6 ######

map1 <- leaflet() %>%
addTiles() %>%

addPolygons(data = polygon1,color="grey",stroke = FALSE,layerId = 1)%>%
addPolygons(data = polygon2,color="yellow",stroke = FALSE,layerId = 2)%>%
addPolygons(data = polygon3,color="#ffbf00",stroke = FALSE,layerId = 3)%>%
addPolygons(data = polygon4,color="red",stroke = FALSE,layerId = 4)%>%
addPolygons(data = polygon5,color="#8B0000",stroke = FALSE,layerId = 5)%>%
addPolygons(data = polygon6,color="purple",stroke = FALSE,layerId = 6)%>%

addPolylines(data = Polyline1,lng = ~as.numeric(Lon),lat = ~as.numeric(Lat),layerId = 7)
Any help is appreciated..
Thank you for your time.