Hello,
This is a very simple question but I can't seem to find any answers on this (likely because its too simple). How do I change specific points of my line graph to a different colour without changing the whole line colour? I have attached a photo of my current graph along with the desired graph.
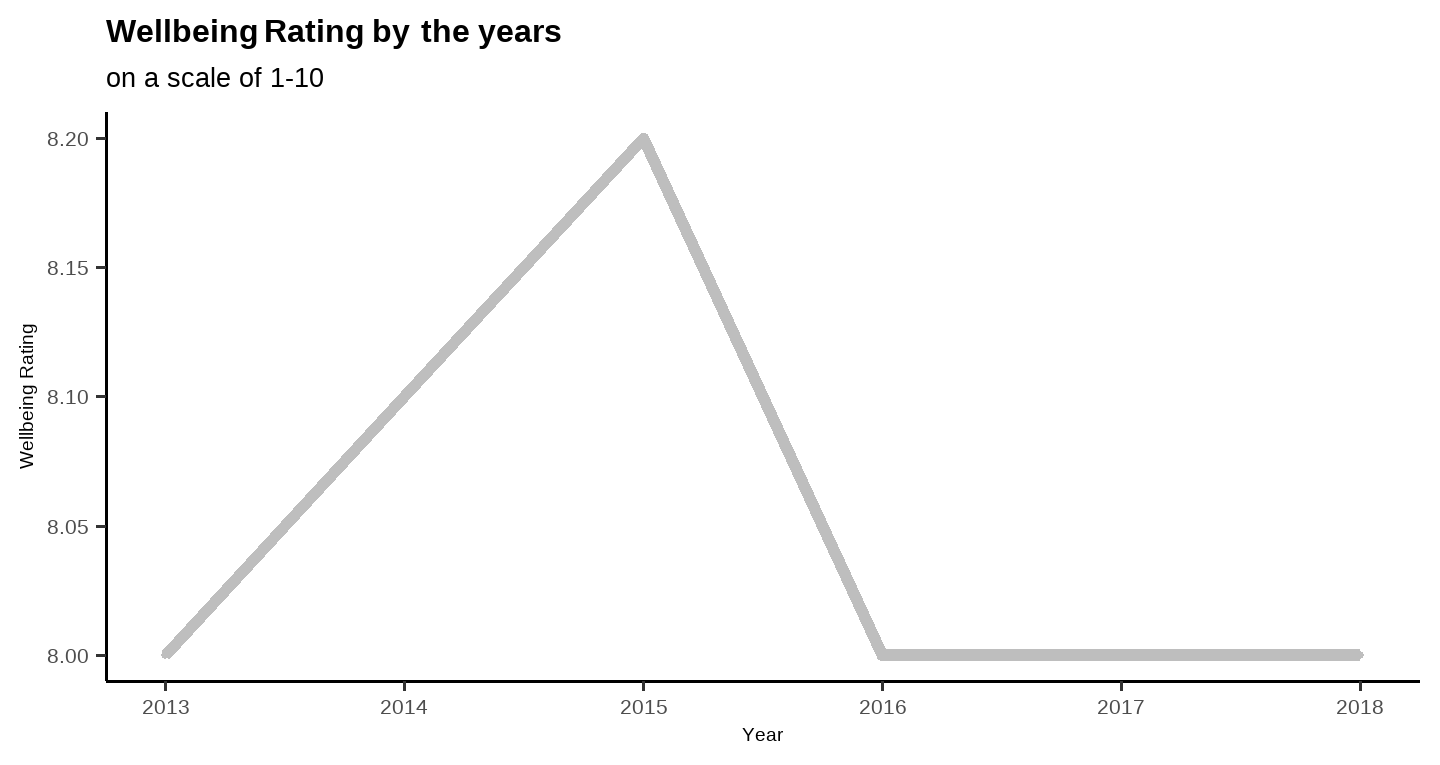
Current graph:
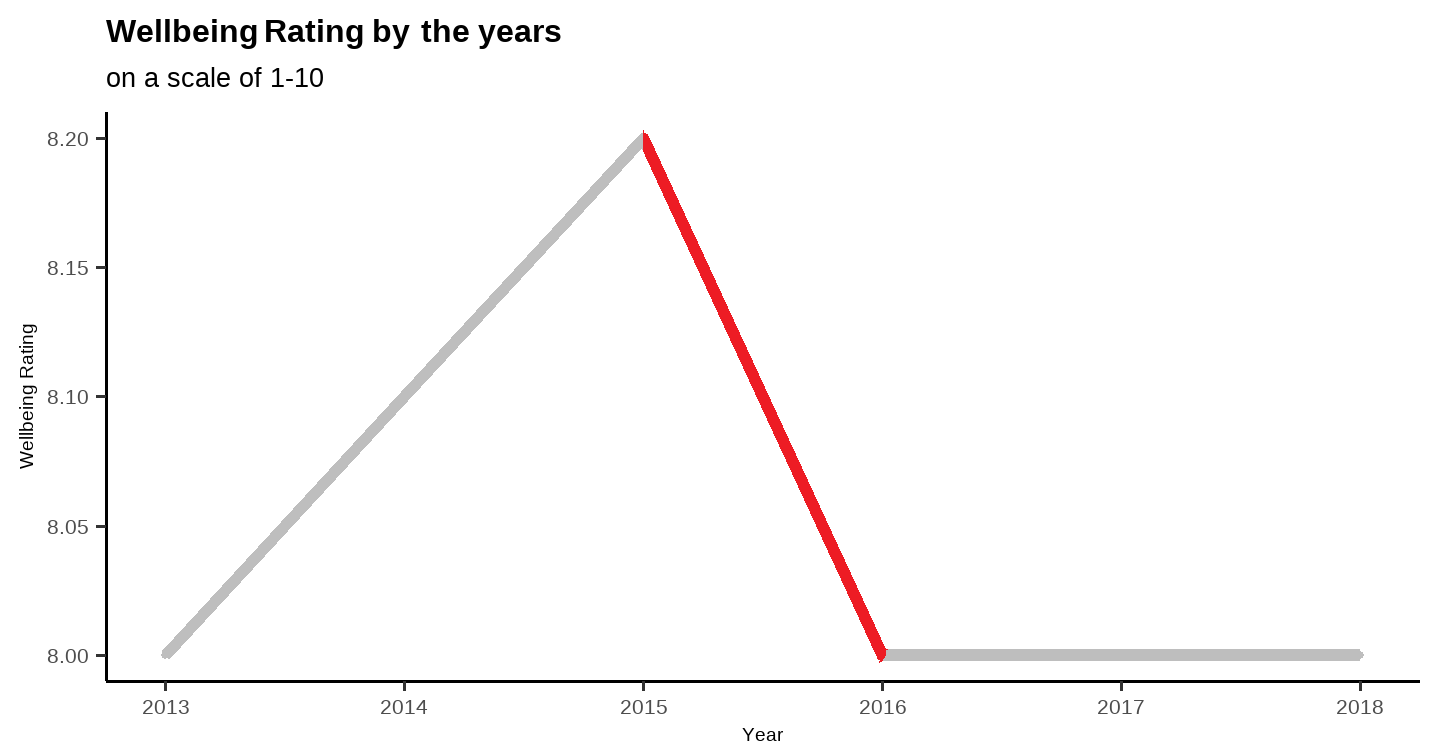
Desired graph:
Here is my code:
wellbeingrating <- data_frame(Year = c(2013:2018),
                              Wellbeing = c(8,8.1,8.2,8,8,8))

mygraph <- ggplot(data= wellbeingrating, aes(x=Year, y=Wellbeing, group=1)) +
  geom_line( color="grey", size=3, alpha=5, linetype=1)+
  geom_point(color = "grey")+
  labs(title = "Wellbeing Rating by the years",
       subtitle = "on a scale of 1-10")+
  theme_classic(base_size = 20)+
  theme(text = element_text(family = "montserrat"),
        plot.title = element_markdown(size=24, face = "bold"),
        axis.title.x = element_text(size=14),
        axis.title.y = element_text(size=14),
        plot.caption = element_markdown(size=10))

mygraph