mean_sim <- 5
up_lmt <- (max(1:10) * 2 * mean_sim)
u <- seq(from = 0,
to = up_lmt,
length.out = 1e+3)
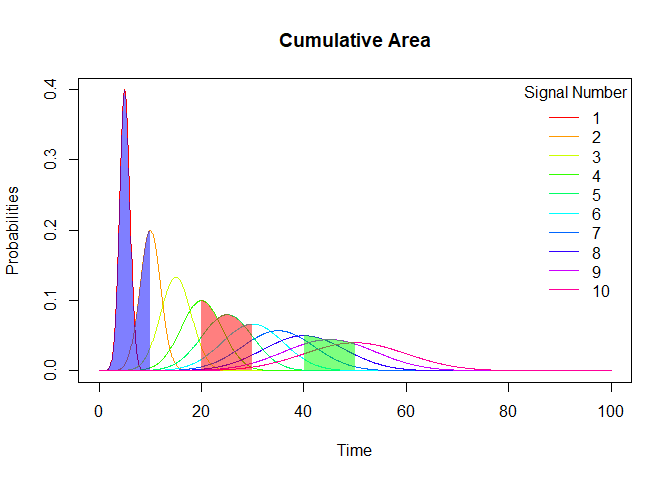
v <- sapply(X = 1:10,
FUN = function(i) dnorm(x = u,
mean = (i * mean_sim),
sd = i))
matplot(x = u,
y = v,
type = "l",
lty = 1,
col = rainbow(n = 10),
xlab = "Time",
ylab = "Probabilities",
main = "Cumulative Area")
legend(x = "topright",
title = "Signal Number",
legend = 1:10,
col = rainbow(n = 10),
bty = "n",
lty = 1)
shade_and_find_area <- function(start_pt, end_pt, colour = "grey")
{
idx <- ((u >= start_pt) & (u <= end_pt))
u_obj <- u[idx]
v_obj <- apply(X = v[idx, ],
MARGIN = 1,
FUN = max)
polygon(x = c(start_pt, u_obj, end_pt),
y = c(0, v_obj, 0),
border = NA,
col = adjustcolor(col = colour,
alpha.f = 0.5))
DescTools::AUC(x = c(start_pt, u_obj, end_pt),
y = c(0, v_obj, 0))
}
shade_and_find_area(start_pt = 0,
end_pt = 10,
colour = "blue")
#> [1] 1.401842
shade_and_find_area(start_pt = 20,
end_pt = 30,
colour = "red")
#> [1] 0.7824488
shade_and_find_area(start_pt = 40,
end_pt = 50,
colour = "green")
#> [1] 0.4452164
1 Like