jkatam
January 2, 2023, 4:34am
1
could you please suggest a way to assign the title to the consort diagram generated using DiagrammeR package. Also i tried to color the boxes of all the nodes using fillcolor=blue in the node, but that does not seem to work,
library(tidyCDISC)
library(tidyverse)
library(ggalluvial)
library(DiagrammeR)


data('adsl', package='tidyCDISC')

# randomized population
pop1 <- adsl %>% rename_all(tolower) %>% filter(saffl=='Y') %>% count() %>%
  mutate(col1=paste0('Safety Population\n(N=',n,')'))

popt <- adsl %>% rename_all(tolower) %>% filter(saffl=='Y') %>% group_by(trt01a) %>% count() %>%
  mutate(col1=paste0(trt01a,'\n(N=',n,')'))

DiagrammeR::grViz("
              digraph box  {
               graph [layout=dot, overlap = true, fontsize = 10]

               node [shape=box, fontname = Helvetica, color = blue, fillcolor = red]

               total_population [label = '@@1'];
               placebo [label = '@@2'];
               xanomeline_low_dose [label = '@@3'];
               xanomeline_high_dose [label = '@@4'];


               total_population  -> placebo total_population -> xanomeline_low_dose total_population -> xanomeline_high_dose

                            }

              [1]:  pop1$col1
              [2]:  popt$col1[1]
              [3]:  popt$col1[3]
              [4]:  popt$col1[2]

                  ")
Are you open using a separate package to create the graph object nodes and edges? There are ways to render those in ggplot, which provides the ability to create titles, subtitles and captions. In addition, decorations of edges and nodes can be finely customized.
jkatam
January 2, 2023, 2:59pm
3
sure, i am open to try other packages
I've found an alternative that supersets ggplot, so will be almost infinitely arrangeable. Working on an example.
The positioning of the bottom right box is off. Can be fixed by putting the linebreak after the first word, I think.
# graphPlot.R
# given a data frame, construct a graph plot
# note: "graph" means a graph object of nodes
# and edges, not a plot
# libraries
library(dplyr)
#>
#> Attaching package: 'dplyr'
#> The following objects are masked from 'package:stats':
#>
#> filter, lag
#> The following objects are masked from 'package:base':
#>
#> intersect, setdiff, setequal, union
library(ggraph)
#> Loading required package: ggplot2
library(tidygraph)
#>
#> Attaching package: 'tidygraph'
#> The following object is masked from 'package:stats':
#>
#> filter
# data
data('adsl', package='tidyCDISC')
# preprocessing
## randomized population
pop1 <- adsl %>% rename_all(tolower) %>% filter(saffl=='Y') %>% count() %>%
mutate(col1=paste0('Safety Population\n(N=',n,')'))
pop1 <- pop1[2][[1]]
popt <- adsl %>% rename_all(tolower) %>% filter(saffl=='Y') %>% group_by(trt01a) %>% count() %>%
mutate(col1=paste0(trt01a,'\n(N=',n,')'))
# nodes
pop <- pop1
placebo <- popt[1,3][[1]]
high_dose <- popt[2,3][[1]]
low_dose <- popt[3,3][[1]]
input <- data.frame(from = rep(1,4), to = 1:4,
node = c(pop,placebo,high_dose,low_dose))
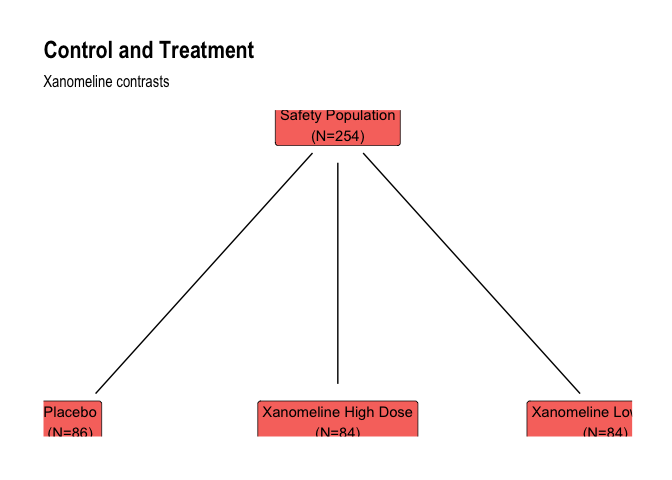
# main
title <- "Control and Treatment"
subtitle <- "Xanomeline contrasts"
# add titles, node shapes, labels, color and edges
rstat_nodes <- data.frame(name = input$node)
rstat_edges <- data.frame(from = c(1,1,1,1),
to = c(1,2,3,4))
gr <- tbl_graph(nodes = rstat_nodes, edges = rstat_edges)
ggraph(gr, 'dendrogram') +
geom_node_label(aes(label = name, fill = "red")) +
geom_edge_link(start_cap = circle(1, 'cm'), end_cap = circle(1, 'cm')) +
ggtitle(title) +
labs(subtitle = subtitle) +
guides(fill = "none") +
theme_graph()
#> Warning: Using the `size` aesthetic in this geom was deprecated in ggplot2 3.4.0.
#> ℹ Please use `linewidth` in the `default_aes` field and elsewhere instead.
Created on 2023-01-04 with reprex v2.0.2
jkatam
January 4, 2023, 1:58pm
7
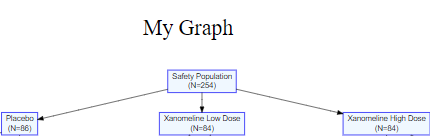
thank you so much @technocrat , its very helpful. Also, I found a way to apply the titles in DiagrammeR::grViz, the approach is to use labelloc='t' and label='My Graph' in the graph statement. We can also change the background color of the nodes via style=filled
graph [layout=dot, overlap = true, fontsize = 10, labelloc='t' , label='My Graph', fontsize='40']
node [style=filled, shape=box, fontname = Helvetica, color = blue, fillcolor = aliceblue]
1 Like
system
January 11, 2023, 1:59pm
8
This topic was automatically closed 7 days after the last reply. New replies are no longer allowed.