Hello community.
I'm drawing an NMDS plot with ggplot.
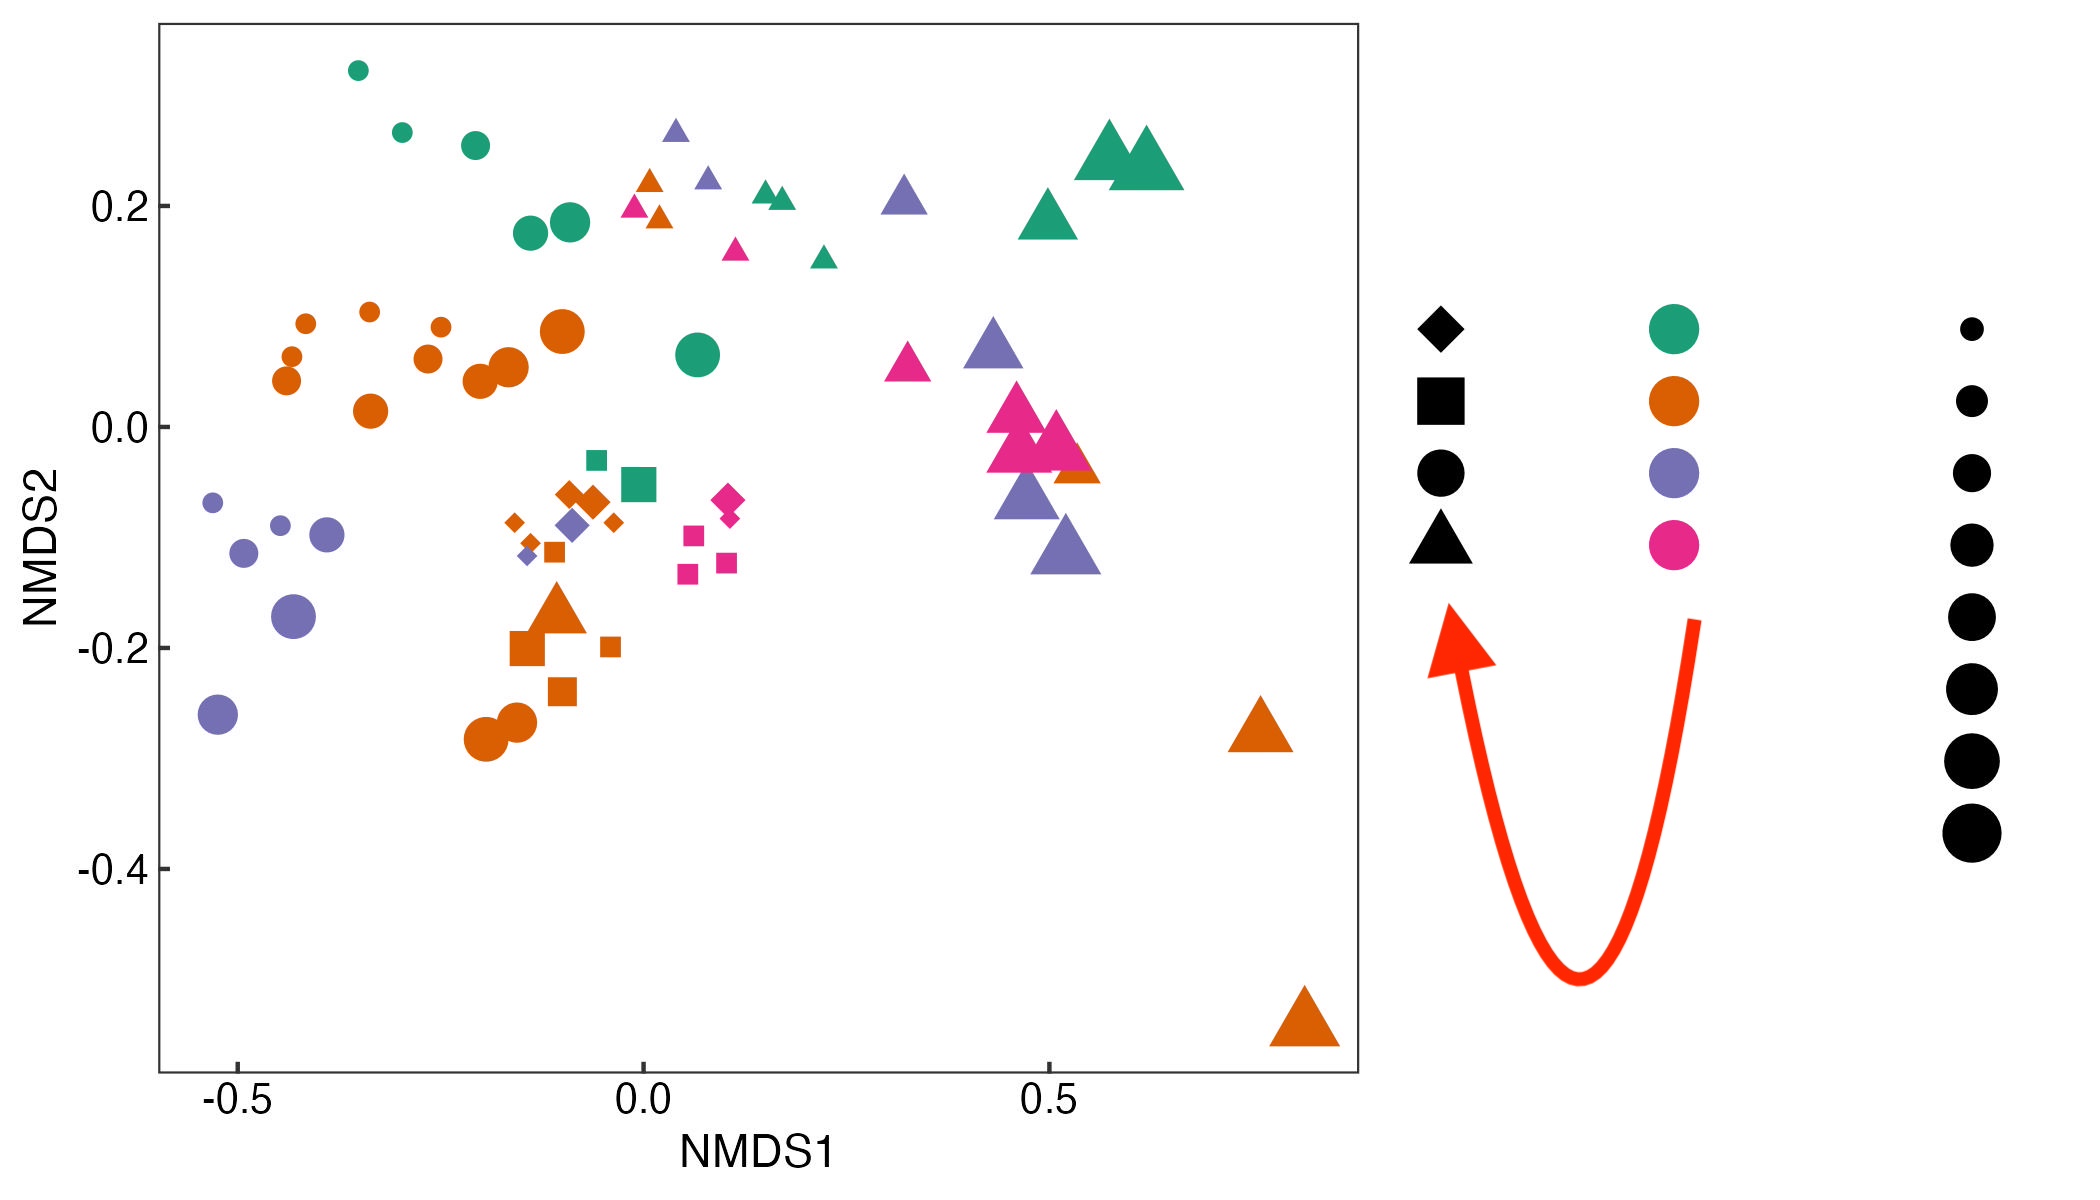
However, I have a question regarding the position of the legend.
The attached plot has three columns in the legend, but I'd like to combine "Year" and "Seasons" into one column.
I would appreciate any advice you can give me.
Thank you.
ggplot(microbiome_plot, aes(x = MDS1, y = MDS2)) +
  geom_point(aes(color = A, shape = B, size = C)) +
  scale_shape_manual(values = c(18, 15, 16, 17)) +
  guides(color = guide_legend(byrow = F, ncol = 1, order = 2, override.aes = list(size = 5)),
         shape = guide_legend(byrow = F, ncol = 1, order = 1, override.aes = list(size = 5)),
         size = guide_legend(byrow = F, ncol = 1, order = 3, label.hjust = 1)
         ) +
  xlab("NMDS1") +
  ylab("NMDS2") +
  theme_test() +
  theme(axis.ticks.length = unit(-1, "mm"),
        axis.text = element_text(size =10, color = "black"),
        legend.box = "horizontal",
        legend.text = element_text(size = 10, color = "black"),
        legend.key = element_rect(fill = "transparent", color = NA),
        legend.background = element_rect(fill = "transparent", color = NA),
        plot.background = element_rect(fill = "transparent", color = NA),
        panel.background = element_rect(fill = "transparent", color = NA)
        ) +
  scale_color_brewer(palette = "Dark2")