
Hi all,
I am working on the Bellabeat public dataset and I want to aggregate heart rate values by seconds(60 secons) using the Time column which I created:
heart_rate<- heart_rate%>%
mutate(Time=as_hms(Time))
Does anyone have an idea how I can do it?
Thanks
Panos
The Bellabeat public dataset seems to have ~9 .csv files. Which one are you using?
Can you also show us the code you are using Just copy the code and paste it between these tickmarks.
```
```
Thanks.
heart_rate<- read.csv("heartrate_seconds_merged.csv")
heart_rate$Time=as.POSIXct(heart_rate$Time, format="%m/%d/%Y %I:%M:%S %p", tz=Sys.timezone())
glimpse(heart_rate)
heart_rate<- heart_rate%>%
separate(Time,c("Date","Time"),sep=" ")
glimpse(heart_rate)
heart_rate<- heart_rate%>%
mutate(Date=as.Date(Date))
glimpse(heart_rate)
heart_rate<- heart_rate%>%
mutate(Time=as_hms(Time))
Up to that point I have worked I split the Date column to Date and Time(hms). I want to aggegate values every 60 seconds
Thanks for the code.
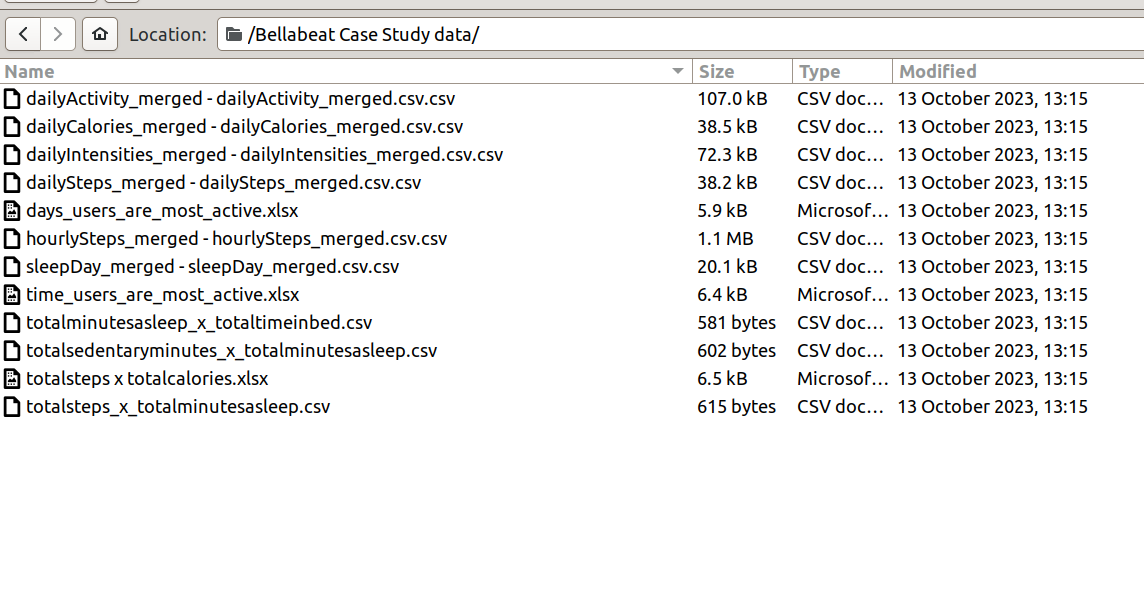
I downloaded the file archive.zip from kaggle . When the archive is unpacked I get two folders Bellabeat Case Study data and Bellabeat Case Study pivot tables but I cannot see heartrate_seconds_merged.csv.
Below is a screenshot of the contents of Bellabeat Case Study data.
Have I downloaded the wrong dataset? If so, can you point me to a better source or. perhaps, you could just post some sample data here? A handy way to supply some sample data is the dput() function. In the case of a large dataset something like dput(head(mydata, 100)) should supply the data we need. Just do dput(mydata) where mydata is your data. Copy the output and paste it here between
```
```
Hi,
the original file name was "

Bellabeat-Case-Study/FitBit Dataset/Fitabase Data 4.12.16-5.12.16.zip at main · sayantanbagchi/Bellabeat-Case-Study · GitHub
Thanks. Your link took me to Fitabase Data 4.12.16-5.12.16.zip which when downloaded and unpacked gives me heartrate_seconds_merged.csv. I do not see a .xlsx file. Should I assume that heartrate_seconds_merged.csv is the .csv equivalent?
1 Like
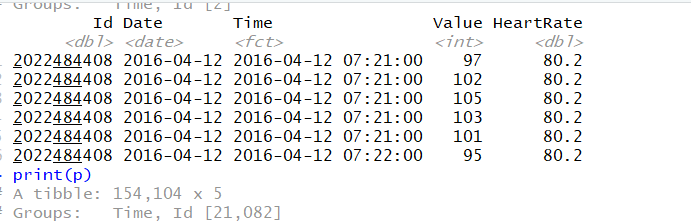
I added a code my analysis:
t<- heart_rate %>%
mutate(Time = as.POSIXct(paste(Date, Time))) %>%
group_by(Time = cut(Time, breaks="1 min"),Id) %>%
mutate(HeartRate = mean(Value))
However the output is not what i wanted:
Does something like this do you any good?
(shamelessly stolen from R aggregate second data to minutes more efficient)
library(data.table)
DT1 <- fread("~/RJunk/datasets/heartrate_seconds_merged.csv")
DT1[, Time := as.POSIXct(Time, format="%m/%d/%Y %I:%M:%S %p", tz=Sys.timezone())]
DT1[, agg := sum(Value), by = .(timestamp = cut(Time, breaks= "1 min"))]
OOPS. that should read
library(data.table)
DT1 <- fread("~/RJunk/datasets/heartrate_seconds_merged.csv")
DT1[, Time := as.POSIXct(Time, format="%m/%d/%Y %I:%M:%S %p", tz=Sys.timezone())]
DT1[, agg :=  mean(Value), by = .(timestamp = cut(Time, breaks= "1 min"))]
DT
I finally found some time to get back to this problem.
I think this may do what you want.
library(data.table)
library(lubridate)
DT1<- fread("~/RJunk/datasets/heartrate_seconds_merged.csv")
DT1[, Time := as.POSIXct(Time, format="%m/%d/%Y %I:%M:%S %p", tz=Sys.timezone())]
DT1[, agg := mean(Value),  by = .(timestamp = cut(Time, breaks= "1 min"))]
DT1[, Time := floor_date(Time, "minute")]

DT2  <- DT1[, .SD[1], by= Time]
DT2[1:5,]
1 Like
Hi,
a quick question. I haven't understood why you replace the DT1 frame with the DT2 data frame. DT2 <- DT1[, .SD[1], by= Time]
SD is the function?
Many thanks for all your support. You are a star
DT1 is still the complete 2,483,658 row dataset while DT2 is only 44,181 rows.
DT1[, .N]
DT2[, .N]
I did not have to create a new data.table. It was just easier when I was debugging plus I like to have a complete dataset handy if I need to compare results. It's probably cleaner not to have DT2 in the final code.
SD is a miraculous data.table function that does all sorts of amazing things. Someday, I may even master a few of them.How to use .SD in the R data.table package or better yet, Making .SD your best friend. Some of How to use .SD in the R data.table package is dated and the code does not run without editing.
1 Like
This topic was automatically closed 21 days after the last reply. New replies are no longer allowed.
If you have a query related to it or one of the replies, start a new topic and refer back with a link.