My study is about the influence of board diversity (gender and age) and fund size on the voting behavior of pension funds. I have also included control variables that concern the board type, board size, fund type, and also control for time.
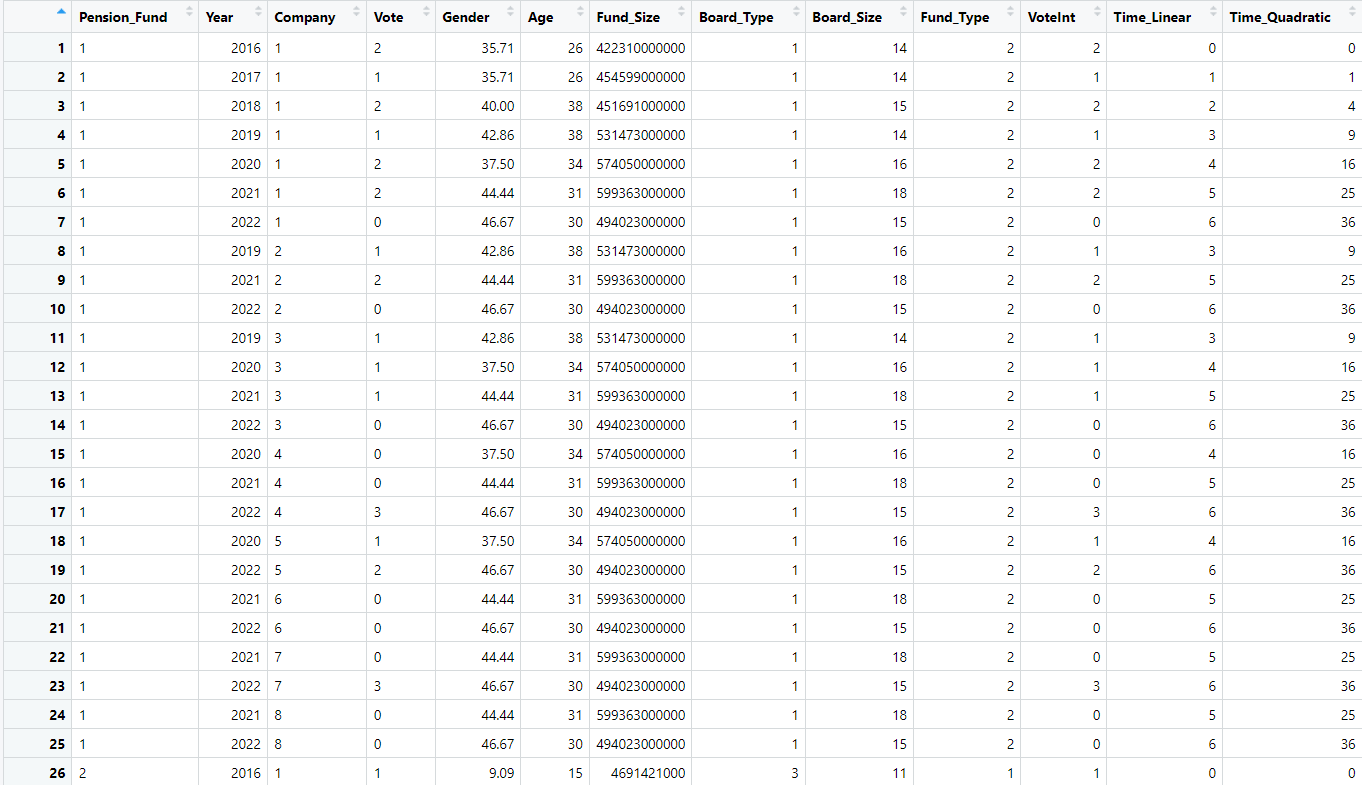
This is only a snippet, but I have data on 38 pension funds who have voted on 8 different companies across multiple years. This is why I included random effects (my observations are not independent from each other). Furthermore, Vote is the dependent variable and Gender, Age, Fund_Size are my independent variables. My code looks like this:
gam(list(VoteInt ~ Gender + Age + Board_Size + Board_Type + Fund_Type + Time_Linear + s(Pension_Fund, bs = "re") + s(Company, bs = "re"),
                 ~ Gender + Age + Board_Size + Board_Type + Fund_Type + Time_Linear + s(Pension_Fund, bs = "re") + s(Company, bs = "re"),
                 ~ Gender + Age + Board_Size+ Board_Type+ Fund_Type+ Time_Linear+ s(Pension_Fund, bs = "re")+ s(Company, bs = "re"),
                 ~ Gender + Age + Board_Size+ Board_Type+ Fund_Type+ Time_Linear+ s(Pension_Fund, bs = "re")+ s(Company, bs = "re")),
              family = multinom(K = 4), data = Data_FINAL)
And the summary of my model looks like this:
Family: multinom
Link function:

Formula:
`VoteInt ~ Gender + Age + Board_Size + Board_Type + Fund_Type + Time_Linear + Time_Quadratic + s(Pension_Fund, bs = "re") + s(Company, bs = "re") ~ Gender + Age + Board_Size + Board_Type + Fund_Type + Time_Linear + Time_Quadratic + s(Pension_Fund, bs = "re") + s(Company, bs = "re")
~Gender + Age + Board_Size + Board_Type + Fund_Type + Time_Linear + Time_Quadratic + s(Pension_Fund, bs = "re") + s(Company, bs = "re") ~ Gender + Age + Board_Size + Board_Type + Fund_Type + Time_Linear + Time_Quadratic + s(Pension_Fund, bs = "re") + s(Company, bs = "re")`

    Parametric coefficients:
                      Estimate Std. Error z value Pr(>|z|)
    (Intercept)       4.466425   1.660200   2.690  0.00714 **
    Gender           -0.004713   0.017598  -0.268  0.78886
    Age              -0.072018   0.028087  -2.564  0.01034 *
    Board_Size        0.059774   0.097628   0.612  0.54036
    Board_Type        0.371302   0.207263   1.791  0.07322 .
    Fund_Type        -0.690773   0.593078  -1.165  0.24413
    Time_Linear      -0.870433   0.331964  -2.622  0.00874 **
    Time_Quadratic   -0.012734   0.044390  -0.287  0.77421
    (Intercept).1     1.608973   1.179053   1.365  0.17237
    Gender.1         -0.002788   0.013254  -0.210  0.83340
    Age.1            -0.058961   0.022502  -2.620  0.00879 **
    Board_Size.1      0.081464   0.069461   1.173  0.24088
    Board_Type.1      0.317223   0.121651   2.608  0.00912 **
    Fund_Type.1      -0.190059   0.350472  -0.542  0.58762
    Time_Linear.1    -0.089743   0.315876  -0.284  0.77633
    Time_Quadratic.1 -0.067089   0.040601  -1.652  0.09846 .
    (Intercept).2    -4.069578   2.807917  -1.449  0.14725
    Gender.2          0.013059   0.025064   0.521  0.60234
    Age.2             0.003533   0.039827   0.089  0.92930
    Board_Size.2     -0.298899   0.145000  -2.061  0.03927 *
    Board_Type.2     -0.025187   0.281487  -0.089  0.92870
    Fund_Type.2       1.290481   0.802374   1.608  0.10776
    Time_Linear.2     0.010836   0.830649   0.013  0.98959
    Time_Quadratic.2  0.083271   0.090332   0.922  0.35661
    (Intercept).3    -0.994601   2.515822  -0.395  0.69259
    Gender.3         -0.018943   0.019669  -0.963  0.33548
    Age.3            -0.035921   0.044371  -0.810  0.41819
    Board_Size.3      0.113424   0.120216   0.943  0.34543
    Board_Type.3     -0.109712   0.289897  -0.378  0.70510
    Fund_Type.3       0.247172   0.970303   0.255  0.79893
    Time_Linear.3    -0.675938   0.462838  -1.460  0.14417
    Time_Quadratic.3  0.106795   0.055379   1.928  0.05380 .
    ---
    Signif. codes:  0 ‘***’ 0.001 ‘**’ 0.01 ‘*’ 0.05 ‘.’ 0.1 ‘ ’ 1

    Approximate significance of smooth terms:
                         edf Ref.df Chi.sq  p-value
    s(Pension_Fund)   27.916     36 243.74  < 2e-16 ***
    s(Company)         4.190      7  11.61   0.0447 *
    s.1(Pension_Fund) 21.872     36 148.00 9.49e-06 ***
    s.1(Company)       4.233      7  14.48   0.0189 *
    s.2(Pension_Fund) 24.770     36 206.25 7.76e-06 ***
    s.2(Company)       5.970      7  47.77 6.43e-06 ***
    s.3(Pension_Fund) 29.069     36 499.22  < 2e-16 ***
    s.3(Company)       6.320      7 147.71  < 2e-16 ***

---
Signif. codes:  0 ‘***’ 0.001 ‘**’ 0.01 ‘*’ 0.05 ‘.’ 0.1 ‘ ’ 1

Deviance explained = 44.6%
-REML = 708.93  Scale est. = 1         n = 950
I checked the validity of my model by performing test for multicollinearity, heteroscedasticity, and the distribution of my residuals (by using VIF, the White test, and the Shapiro-Wilk test). I get the following results:
VIF(model):

      Gender            Age     Board_Size     Board_Type
          1.276704       1.066428       1.225880       1.056866
         Fund_Type    Time_Linear Time_Quadratic
          1.058455      15.856650      15.553722

the White test:

    studentized Breusch-Pagan test

data:  model
BP = 142.44, df = 7, p-value < 2.2e-16

Shapiro-Wilk test:

    Shapiro-Wilk normality test

data:  model$residuals
W = 0.91792, p-value < 2.2e-16
I tried to resolve the heteroscedasticity and the non-normality distribution of the residuals by robust regression but it did not work. Does anyone know how I can solve this?