How can we name the geom_vline on the line itself (preferably parallel to the line itself ?)
Can we write the p,s and m on the geom_vline itself ?
Please consider reprex below.
cuts1 <- data.frame(Ref="p", vals=c(140))
cuts2 <- data.frame(Ref="s", vals=c(300))
cuts3 <- data.frame(Ref="m", vals=c(250))
cuts <- rbind(cuts1, cuts2, cuts3)

ggplot(mtcars, aes(x=disp)) +
   geom_density() + xlim(0,3000)  +
   geom_vline(data = cuts , aes(xintercept=vals, color= Ref) )
1 Like
library(ggplot2)
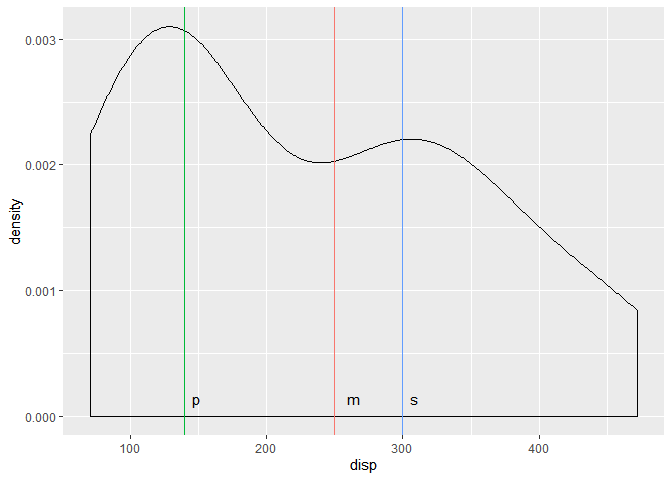
cuts <- data.frame(Ref = c("p", "s", "m"),
vals = c(140, 300, 250),
stringsAsFactors = FALSE)
ggplot() +
geom_density(mapping = aes(x = disp),
data = mtcars) +
geom_vline(mapping = aes(xintercept = vals,
colour = Ref),
data = cuts,
show.legend = FALSE) +
geom_text(mapping = aes(x = vals,
y = 0,
label = Ref,
hjust = -1,
vjust = -1),
data = cuts)
Created on 2019-08-29 by the reprex package (v0.3.0)
Hope this helps.
(You can use the angle argument in aes also.)
2 Likes
Thanks for quick help.
I applied angle but it is not visible within ggplotly.
Do I need to consider something else as well ?
  cuts1 <- data.frame(Ref="p", vals=c(140))
  cuts2 <- data.frame(Ref="s", vals=c(300))
  cuts3 <- data.frame(Ref="m", vals=c(250))
  cuts <- rbind(cuts1, cuts2, cuts3)

  plt = ggplot() +
    geom_density(data = mtcars, mapping = aes(x=disp, group = 1)) +
    geom_vline(data = cuts , aes(xintercept=vals, color= Ref) ) +
    geom_text(mapping = aes(x = vals,
                            y = 0,
                            label = Ref,
                            hjust = -1,
                            vjust = -1,
                            angle = 90),
              data = cuts)


  ggplotly(plt)
I don't have much knowledge on plotly, but I think this is a known issue:
You can consider adding a plotly tag to this topic, or asking a question at plotly community:
1 Like
system
Closed
5
This topic was automatically closed 7 days after the last reply. New replies are no longer allowed.