I want to add hover text to my ggplot graphic. I have tried plotly but it doesn't work with geom_xsidehistogram which is critical to this plot. Does anyone know of any other packages that might have the same tooltip/hover text ability that work with geom_tile and geom_xsidehistogram?
Thanks in advance
Edit:
I should clarify the issue I am having with plotly is that it removes my side histogram. I only need the tool tip/hover text to appear over the tile portion of the graph. So any package that shows hover text over geom_tile and doesn't format side histograms weirdly is a win for me.
I should clarify the issue I am having with plotly is that it removes my side histogram. I only need the tool tip/hover text to appear over the tile portion of the graph. So any package that shows hover text over geom_tile and doesn't format side histograms weirdly is a win.
Unfortunately, when I tried ggiraph I ran into install errors.
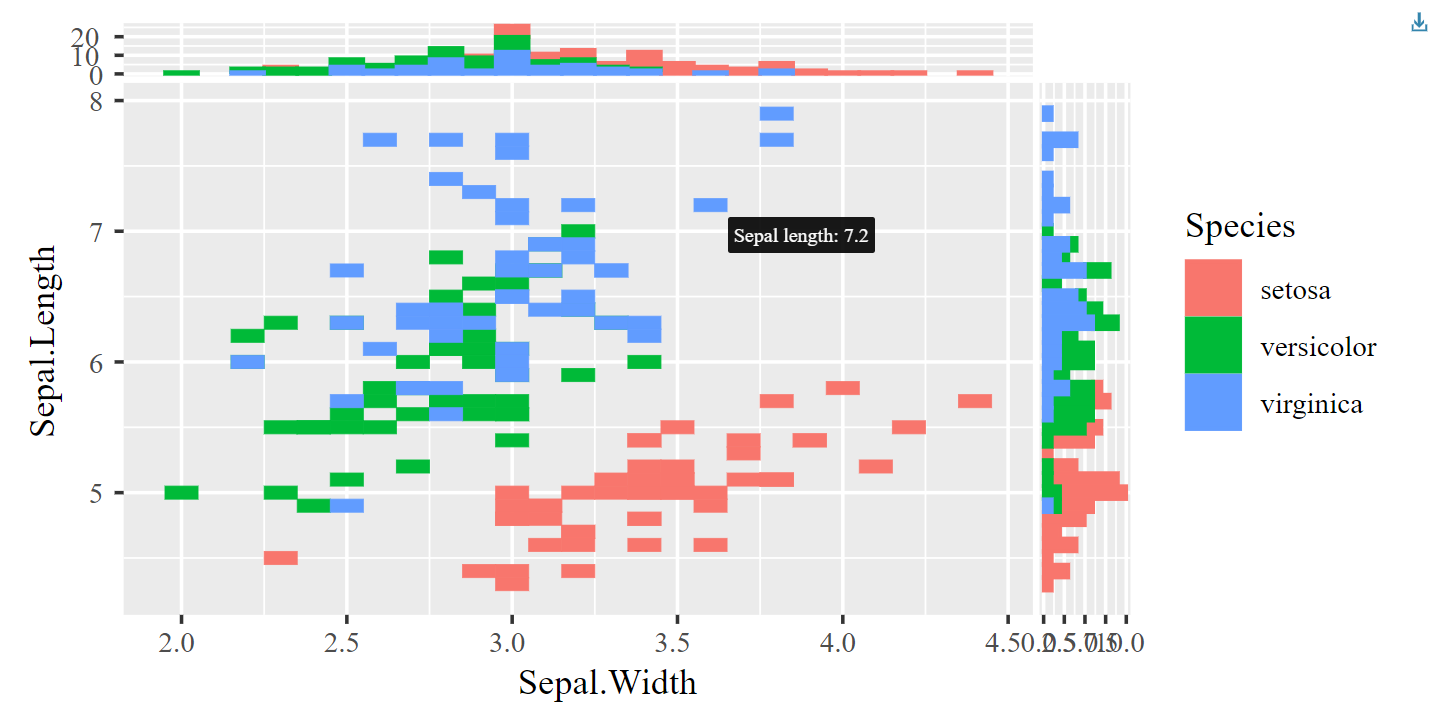
Below is an example using ggiraph and the iris data that provides tooltips over the tiles and preserves the side historgrams. What errors are you getting when trying to install?
I don't know how helpful code will be in this case because I original problem I was having with plotly was that it literally isn't built to work with geom_xsidehistogram. They even provided a warning saying that they aren't implemented for the geom_GeomXsidebar functions yet. I am literally just looking for suggestions of other packages that have similar functionality, that I can investigate further on my own.
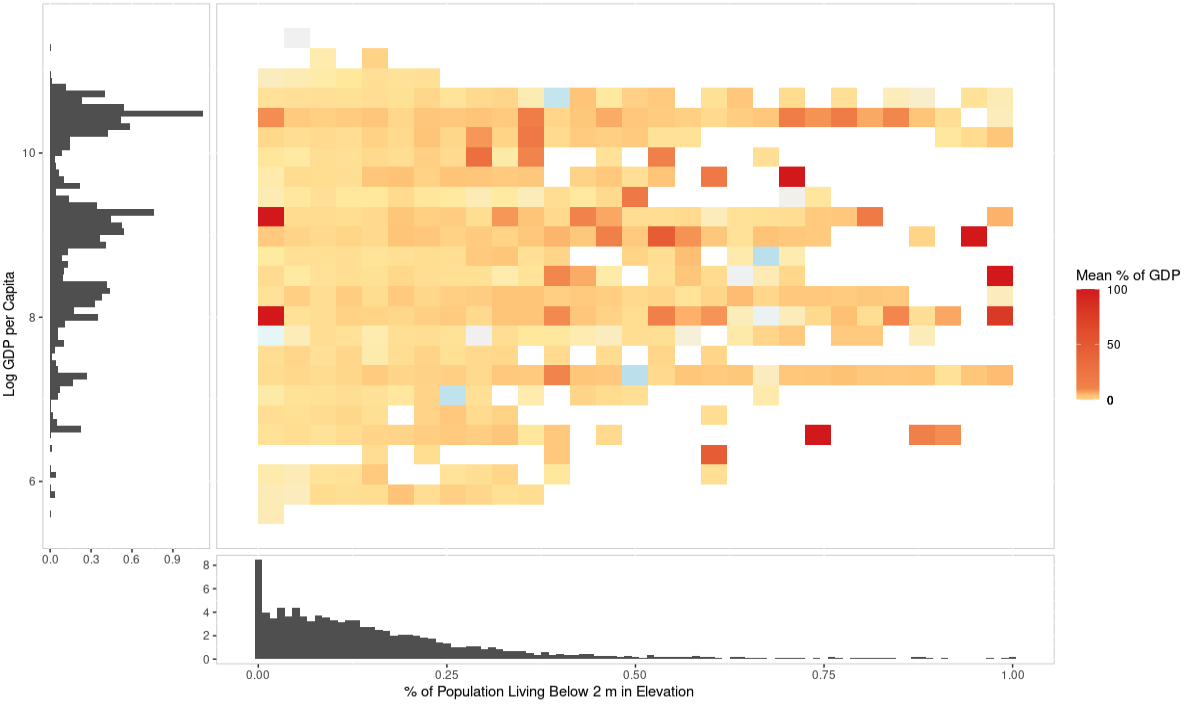
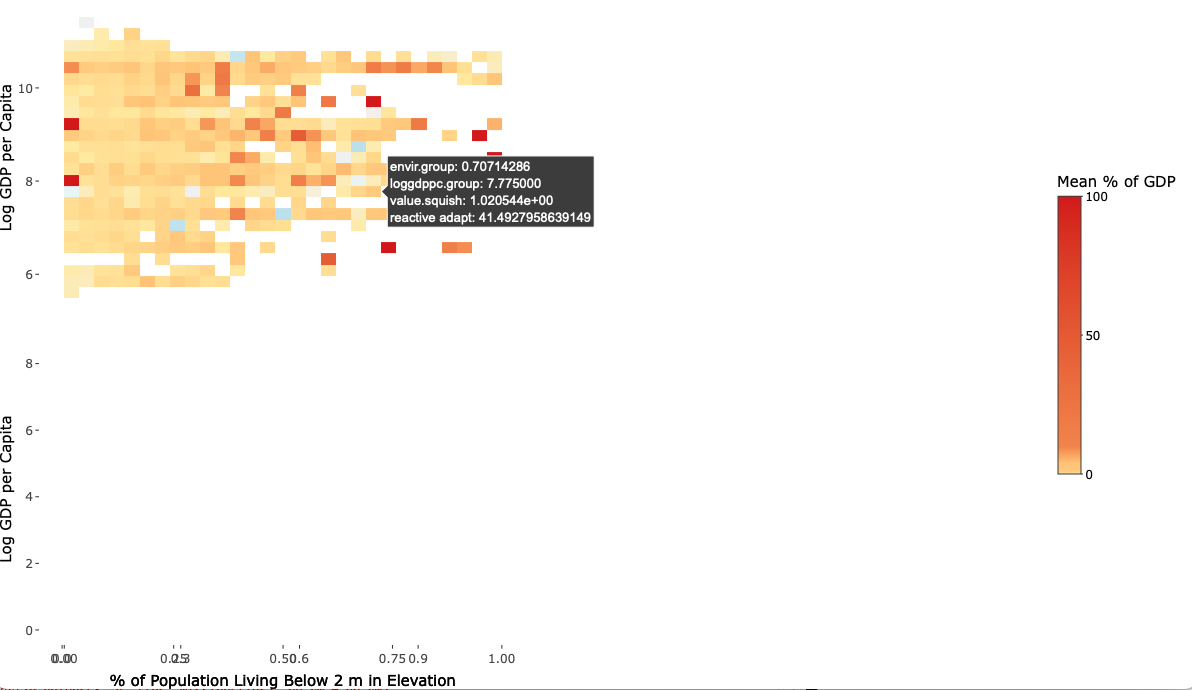
But if you must know my code to answer this question here you go.
My data structure was master - a data frame containing:
region (character)
envir_var_elevation (numeric)
loggdppc (numeric)
value (numeric)
reactive_value (numeric)
df_plot - a data frame containing:
envir.group (numeric factor)
loggdppc.group (numeric factor)
value.squish (numeric)
reactive_value.mean (numeric)
df_plot was created by taking the data from master binning elevation and loggdppc and then finding the mean in each bin combination.
I was getting an Error 1 which seemed to be related to a compilation failure.
The known solutions for this error didn't work for me so I reported an issue to the developer's GitHub so you can read the details of what I experienced there: https://github.com/davidgohel/ggiraph/issues/281