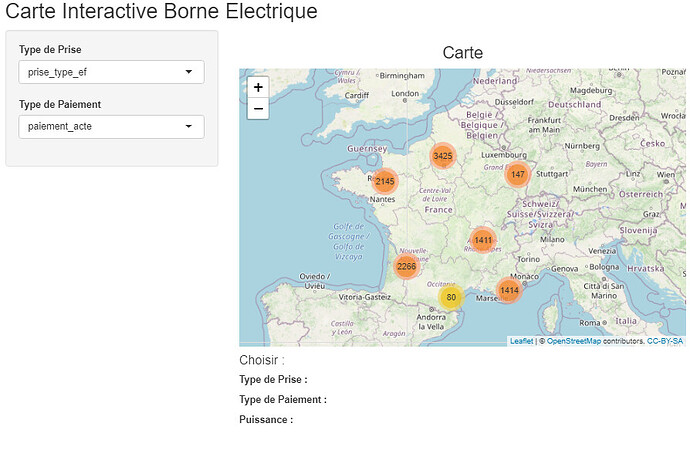
Here is my code
UI :
library(shiny)
library(leaflet)
library(dplyr)
setwd("C:/Users/charl/OneDrive/Documents/Carte_Interactive")
data_carte <- read.csv2("bornes.csv", sep = ",", dec = ".")
Interface
shinyUI(fluidPage(
# Titre Appli
titlePanel("Carte Interactive Borne Electrique"),

# Creation d'une disposition avec panneau lateral et principal
sidebarLayout(
#Panneau lateral
    sidebarPanel(
        selectInput(
          inputId = "idPrise",
          label = "Type de Prise",
          choices = colnames(data_carte)[19:23]
        ),
        selectInput(
          inputId = "idpaiement",
          label = "Type de Paiement",
          choices = colnames(data_carte)[25:27]
        )
    ),

    # Panneau Principal
    mainPanel(
      h3("Carte", align = "center"),
      p(
        leafletOutput("carte_b")
      ),

      h4("Choisir : ", align = "left"),
      p(
        strong("Type de Prise : "),
        textOutput("prise")
      ),
      p(
        strong("Type de Paiement : "),
        textOutput("paiement")
      ),
      p(
        strong("Puissance : "),
        textOutput("puissance")
      )

    )
)
))
Server :
library(shiny)
library(leaflet)
library(dplyr)
Define server logic required to draw a histogram
shinyServer(function(input, output) {
output$carte_b <- renderLeaflet({
  setwd("C:/Users/charl/OneDrive/Documents/Carte_Interactive")
  data_carte <- read.csv2("bornes.csv", sep = ",", dec = ".")

  carte <- leaflet(data_carte)
  carte |>
    addTiles() |>
    fitBounds(3, 43.5, 4, 50.5) |>
    addMarkers(lng = ~consolidated_longitude,
               lat = ~consolidated_latitude,
               popup = ~nom_station,
               clusterOptions = markerClusterOptions())
  })
  })
I created filters on the UI side but I don't know how to apply the filters on the interactive map (leaflet).
