I'm currently producing a forest plot of prevalence rate, and i want to combine the SDI numbers in this forest plot.
The sample data set is:
> df1
# A tibble: 4 × 5
`Countrie Name` prevalence lower upper   SDI
<chr>                <dbl> <dbl> <dbl> <dbl>
  1 Country1                 1   0.5   1.2    20
2 Country2                 2   1.5   2.2    40
3 Country3                 3   2.5   3.2    70
4 Country4                 4   3.5   4.2    80
I have created a nice forest plot with this code:
library(grid)
library(forestploter)

# Read provided sample example data
df1

# Add blank column for the forest plot to display CI.
# Adjust the column width with space, increase number of space below
# to have a larger area to draw the CI.
df1$` ` <- paste(rep(" ", 20), collapse = " ")


# Create confidence interval column to display


df1$`Prevalence, rate per 100k (95% CI)`<- ifelse(is.na(df1$prevalence), "",
  sprintf("%.2f (%.2f to %.2f)",
          df1$prevalence, df1$lower, df1$upper))

tm <- forest_theme(core=list(fg_params=list(hjust = 1, x = 0.9),
                             bg_params=list(fill = c("#f6eff7",  "#d0d1e6",  "#aeb9d3", "#67a9cf"))),
                   colhead=list(fg_params=list(hjust=0.5, x=0.5)))


p <- forest(df1[,c(1, 6:7)],
            est = df1$prevalence,
            lower = df1$lower,
            upper = df1$upper,
            ci_column = 2,
            ref_line = 0,
            xlim = c(0,5),
            ticks_at = c(0, 1, 2, 3, 4),
            footnote = "",
            theme = tm)

# Print plot
plot(p)
Which produced this forest plot:
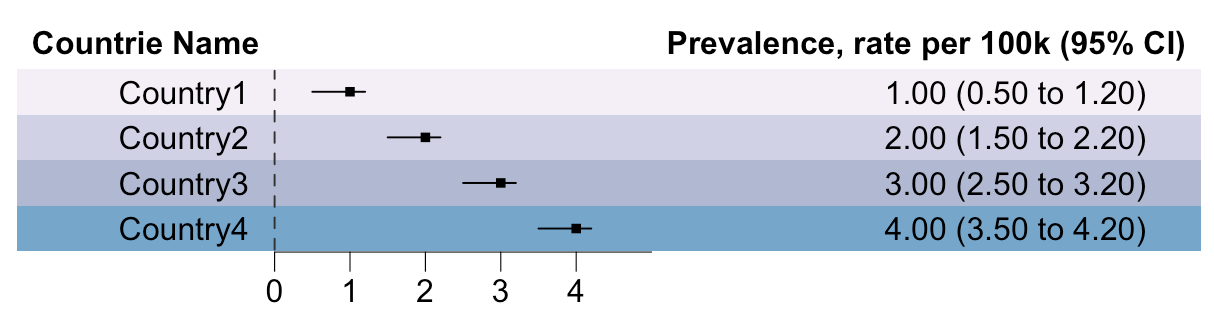
What code should i use to add plot of SDI on it?
Here is an given sample of the idea forest plot which produced by photoshop.
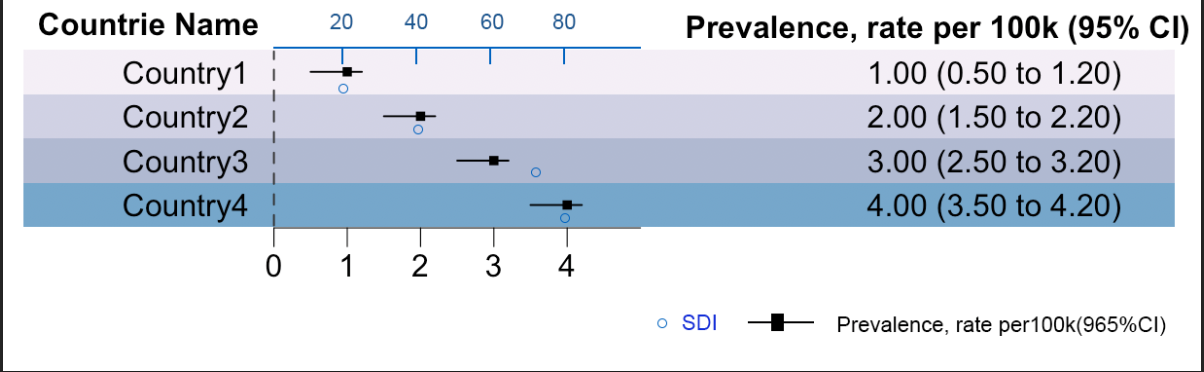
Thank you for your time!