Ellenz
January 5, 2019, 3:38am
1
Hi all,
I have a question about adding separate horizontal lines to different panels in ggplot bar charts.
>     value      group   level
>   -3.659497     1     Level 1
>   -2.372006     2     Level 1
>   -3.435326     3     Level 1
>   -3.492647     4     Level 1
>   -3.589319     5     Level 1
>   -5.498233     1     Level 2
>   -2.720646     2     Level 2
>   -5.055747     3     Level 2
>   -5.113817     4     Level 2
>   -5.311411     5     Level 2
I draw bar plots and combine them together using the code below:
> a.bar= ggplot(a,aes(group,value))+
>   geom_bar(position='dodge',stat='identity')+ facet_wrap(~level,ncol=1)+
>   geom_hline(yintercept=mean(a$value))
> print(a.bar)
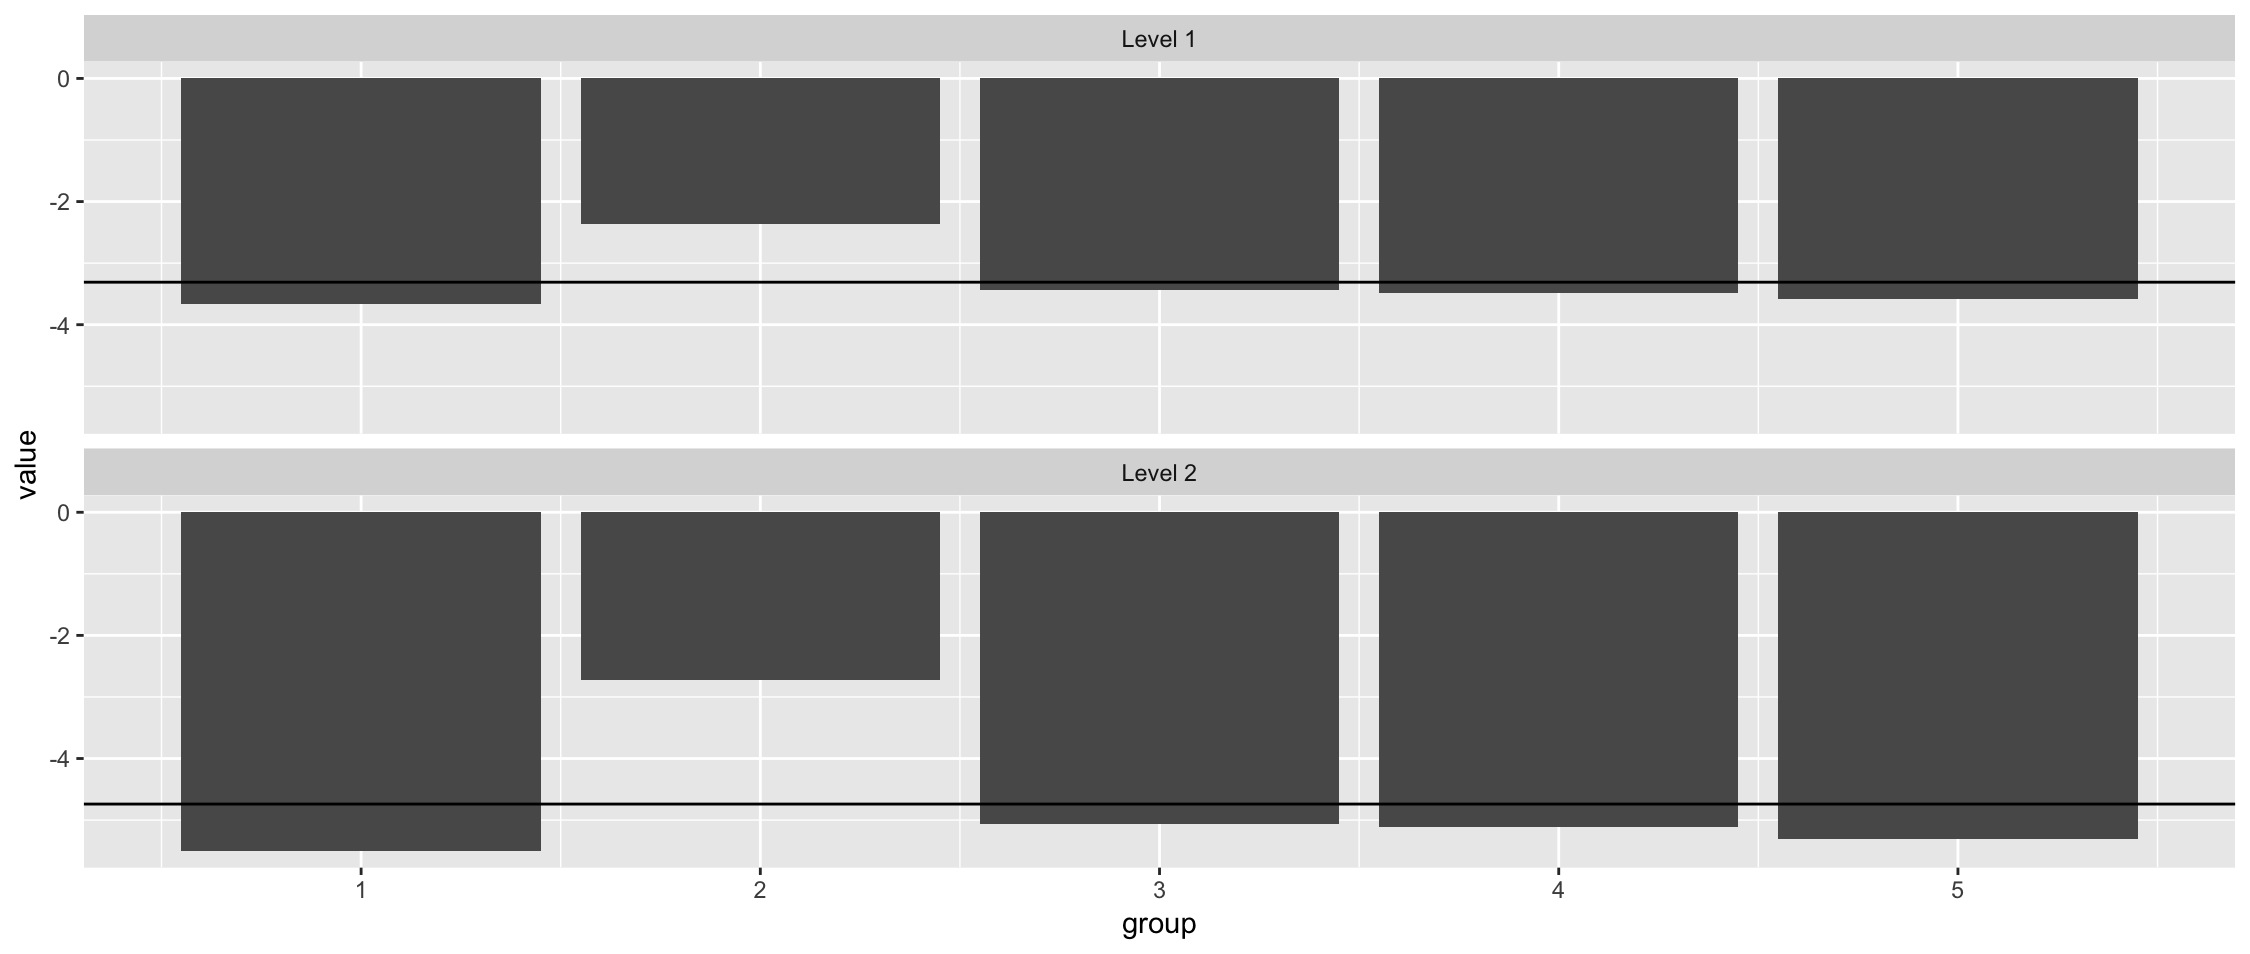
However, I want to add the mean value of Level 1 and Level 2 on the two panels (Level 1 and Level 2) separately, rather than using a whole mean value as the horizontal lines in each panel. How could I achieve this? Thanks for your help.
You can create separate data.frame to calculate means then assign them to geom_hline() layer.
a_mean <- a %>%
  group_by(level) %>%
  summarize(mean_val = mean(value))
print(a_mean)
# A tibble: 2 x 2
  level   mean_val
  <chr>      <dbl>
1 Level 1    -3.31
2 Level 2    -4.74
ggplot(a,aes(group,value))+
  geom_bar(position='dodge',stat='identity')+ facet_wrap(~level,ncol=1)+
  geom_hline(data= a_mean, aes(yintercept=mean_val))
4 Likes
Ellenz
January 5, 2019, 1:27pm
3
Thanks, I tried to install "tidyverse" package in order to use the pipe function, but got the error below. What is the problem of this? Thanks.
require(tidyverse)
If you want to install tidyverse use install.packages("tidyverse") but maybe you want to do an update first update.packages(checkBuilt=TRUE, ask=FALSE)
Just remove the a$ in the hline code.
Ellenz
January 6, 2019, 2:58pm
6
Thanks, it works well in this case.
1 Like
system
January 28, 2019, 12:12am
8
This topic was automatically closed 21 days after the last reply. New replies are no longer allowed.