Hi,
Hope everything's going fine for you.
I'm currently working with the fmsb package to build a radarchart.
I've made a dataframe like this one to be able to draw the chart :
spyder_data <- data.frame(DuelsAeriensOff = c(20, 0, DuelsAeriensOff),
                   DuelsAeriensOffGagnes = c(1, 0, DuelsAeriensOffGagnes),
                   ButTirs16  = c(0.2, 0, ButTirs16),
                   TirsBloques = c(1, 0, TirsBloques),
                   ConversionPasses16 = c(0.2, 0, ConversionPasses16),
                   PassesMatch16 = c(20, 0, PassesMatch16),
                   PassesReussies16 = c(1, 0, PassesReussies16),
                   DangerositePassesCles = c(0.2, 0, DangerositePassesCles),
                   PartCentresSurface = c(1, 0, PartCentresSurface),
                   DistancePassesSurface = c(20, 0, DistancePassesSurface),
                   row.names = c("max", "min", "value"))
and I'm drawing the radarchart with the fonction like this :
radarchart(spyder_data,
           vlabels = labels,
           vlcex = 0.5,
           cglcol = "grey",
           cglty = 1,
           pcol = c(scales::alpha("orange", 1)),
           pfcol = c(scales::alpha("orange", 0.4)),
           plwd = 2
           )
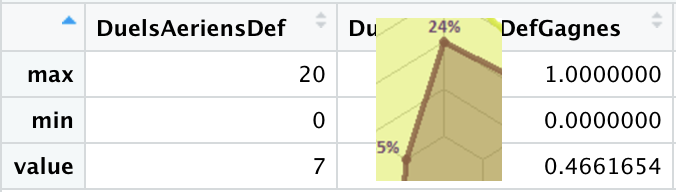
Everything is going fine and I'm obtaining this chart :

But I would like to add data labels next to my oranges chart's points, who are contain in the third column of my spyder_data dataframe.
I searched for hours this afternoon but I didn't find anything... except maybe using the function text() but I don't know how to do it since it's a specific chart.
If anyone have an idea about my issue, I would be very grateful. Have a good evening.