This is happening because you are mapping the fill aesthetic to the Days variable which is continuous ranging from 1 to 31, that is why when you convert it to a factor it has 31 levels.
You cant map a discrete scale to a continuous variable, so you would have to bin your variable first in order to map a discrete variable to a discrete scale, like in this example
library(tidyverse)
Heat_clean <- data.frame(
Days = c(NA, 19, 28, 2, 19, 28, 2, 19, NA, 2, 19, 28, 25, 31, 28,
12, NA, 24, 8, 26, 19),
Apartment_no = as.factor(c("1-SV", "1-SV", "1-SV", "1-SH", "1-SH", "1-SH",
"1-1V", "1-1V", "1-1V", "1-1H", "1-1H", "1-1H",
"3-SV", "3-SV", "3-SV", "3-1V", "3-1V", "3-1V",
"3-1H", "3-1H", "3-1H")),
month = factor(c("September", "October", "November", "September",
"October", "November", "September", "October",
"November", "September", "October", "November",
"September", "October", "November", "September",
"October", "November", "September", "October",
"November"), levels = c("September", "October", "November"))
)
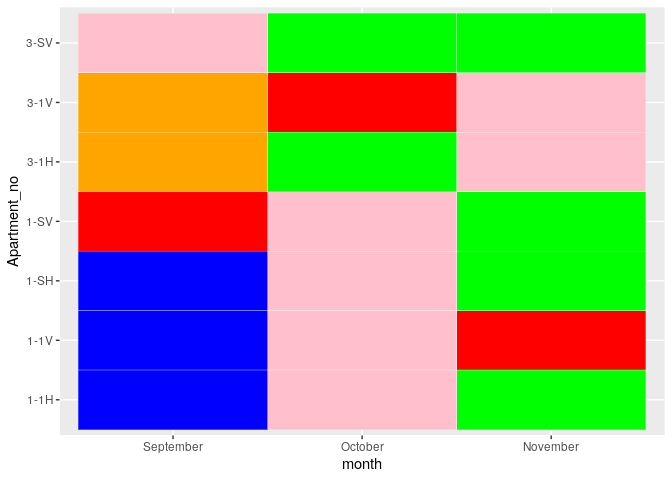
Heat_clean %>%
mutate(color = case_when(
Days <= 5 ~ "blue",
Days <= 15 ~ "orange",
Days <= 25 ~ "pink",
is.na(Days) ~ "red",
TRUE ~ "green" # You haven't defined a color for >25
)) %>%
ggplot(aes(month, Apartment_no)) +
geom_tile(aes(fill = color), color="white") +
scale_fill_identity()
Created on 2019-11-21 by the reprex package (v0.3.0.9000)