library(dplyr)
#>
#> Attaching package: 'dplyr'
#> The following objects are masked from 'package:stats':
#>
#>     filter, lag
#> The following objects are masked from 'package:base':
#>
#>     intersect, setdiff, setequal, union
Apartment_no <- c("1-SV","1-SV","1-SV","1-SH","1-SH","1-SH","1-1V","1-1V","1-1V","1-1H","1-1H","1-1H","3-SV","3-SV","3-SV","3-1V","3-1V","3-1V","3-1H","3-1H","3-1H")
month <- c("September","October","November","September","October","November","September","October","November","September","October","November","September","October","November","September","October","November","September","October","November")
Days <- c(NA,19,28,2,19,28,2,19,NA,2,19,28,25,31,28,12,NA,24,8,26,19)
Heat_clean <- data.frame(Apartment_no,month,Days)
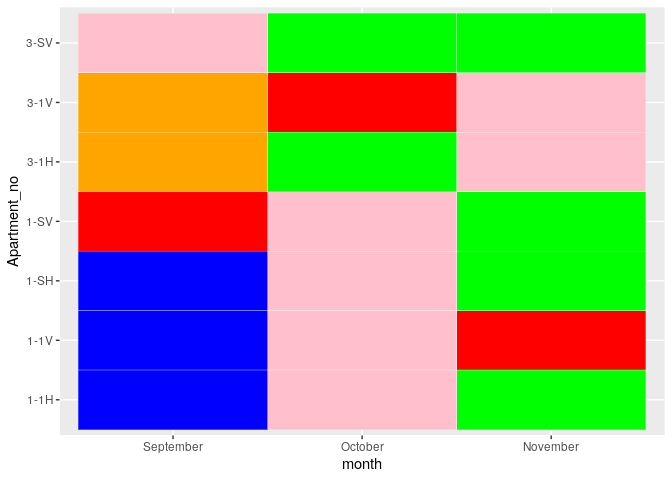
I have the above data, it's actually a sample data, in actual I have around 163 apartments and the data for all the 12 months. So I have plotted an interactive heat and I also want to add my personalized color coding to it, so I have used the following code:
mypalette=rep("Green",length(Days))
mypalette[Days <= 25] = "Pink"
mypalette[Days <= 15] = "Orange"
mypalette[Days <= 5] = "Blue"
mypalette[is.na(Days)] = "Red"
& then I have added it to my plotly code using the undermentioned code
p <- ggplot(Heat_clean,aes(month,as.factor(Apartment_no),fill=Days))+geom_tile(aes(fill=Days),color="white")+scale_fill_manual(values = mypalette)
plotly::ggplotly(p)
But for some reason it's giving me an error and the desired plot is not obtained.
