Hi community
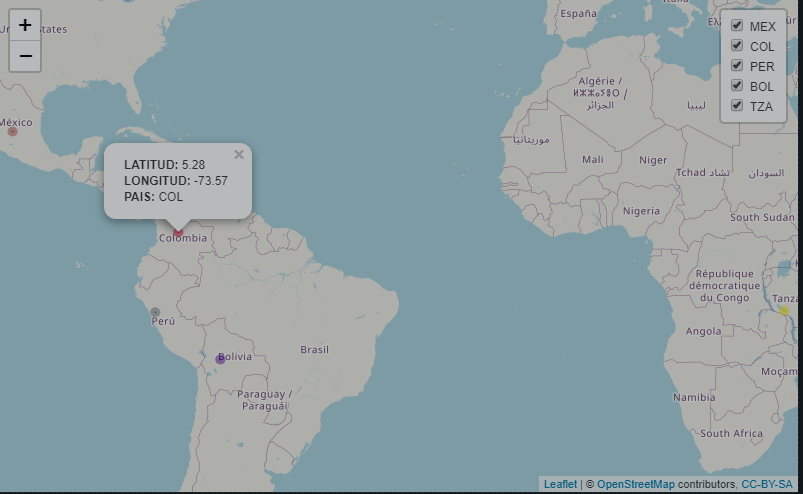
Im have this map with leaflet with different country points, when Im put click in each point show his information.
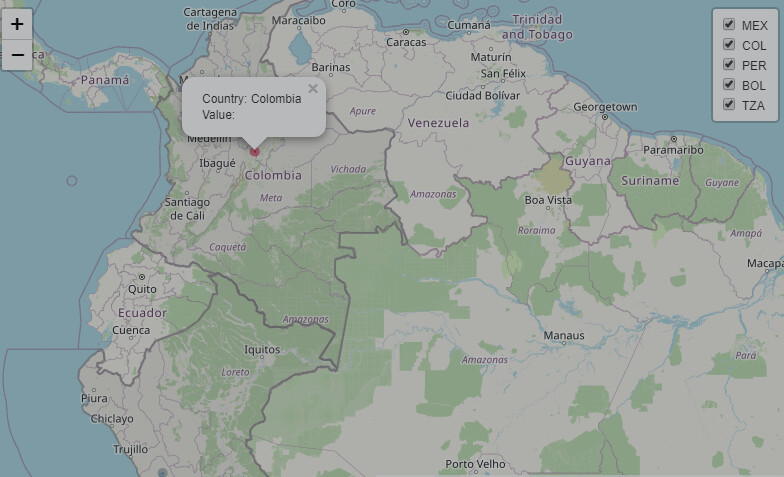
I'm try to add the country polygon information for check the correct coordinates associate with each country. But when put the polygon the data point change.
Other things that I want is when I'm click in a county for example MEX, the map highlight only this associate information: data points and country polygon.
library(leaflet)
library(maps)
library(tidyverse)
library(inlmisc)

map_data <- structure(list(origCty = c("MEX", "COL", "PER", "BOL", "COL", "TZA"),
    latitude = c(22.36, 7.89, -8.8, -16.88, 5.28, -8.53),
    longitude = c(-102.72, -72.65, -77.62, -66.18, -73.57, 32.93)),
    row.names = c(NA, -6L), class = c("tbl_df", "tbl", "data.frame"))

Names_Mun <- map_data$origCty %>% unique()
Colores <- c("#5F11A3","RED","#0F629C", "#F3E908")
pal <- colorFactor(Colores, domain = Names_Mun)

countries <- c("Australia", "Tanzania", "India", "Mexico", "Bolivia", "Peru", "Colombia") # select countries
values <- c(1,2,3,4,5,6)
bounds <- map("world", countries, fill = TRUE, plot = FALSE)

m<-leaflet() %>%
  addTiles() %>%
 # setView(lng=-76.5, lat=2.2 , zoom=9) %>%
   addCircles(data=map_data,
             lng = ~longitude,
             lat=~latitude,
             color=~pal(origCty),
             fillOpacity = 1,
             weight =8,
             popup = paste("<b> LATITUD:</b>",map_data$latitude,"<br>",
                           "<b> LONGITUD:</b>",map_data$longitude,"<br>",
                           "<b> PAIS:</b>", map_data$origCty),group = ~origCty)  %>%

            addLayersControl(overlayGroup=Names_Mun,
                            options = layersControlOptions(collapsed=F))
m
When add the polygon data:
m<-leaflet() %>%
  addTiles() %>%
 # setView(lng=-76.5, lat=2.2 , zoom=9) %>%
   addCircles(data=map_data,
             lng = ~longitude,
             lat=~latitude,
             color=~pal(origCty),
             fillOpacity = 1,
             weight =8,
             popup = paste("<b> LATITUD:</b>",map_data$latitude,"<br>",
                           "<b> LONGITUD:</b>",map_data$longitude,"<br>",
                           "<b> PAIS:</b>", map_data$origCty),group = ~origCty)  %>%

            addLayersControl(overlayGroup=Names_Mun,
                            options = layersControlOptions(collapsed=F)) %>%

  addProviderTiles("OpenStreetMap.Mapnik") %>%  # polygon country
        addPolygons(data = bounds, group = "Countries",
                    color = "gray",
                    weight = 2,
                    popup = paste("Country: ", bounds$names, "<br>",
                                  "Value: ", bounds$value, "<br>"),
                    fillOpacity = 0.1,
                    highlightOptions = highlightOptions(color = "black",
                                                        weight = 2,
                                                        bringToFront = TRUE))

m
Tnks