I have this bar chart which is generated by the following code:
df %>%
  group_by(month) %>%

  ggplot(aes(x = month)) +
  geom_bar( fill='#0C475B', width = 0.58, stat = 'count') +
  theme_bw()+
  scale_y_continuous(breaks = seq(0,1400,100))+
  labs(title="Departure delays in Newark airport per month in 2020",
       x="", y = "number of delays")
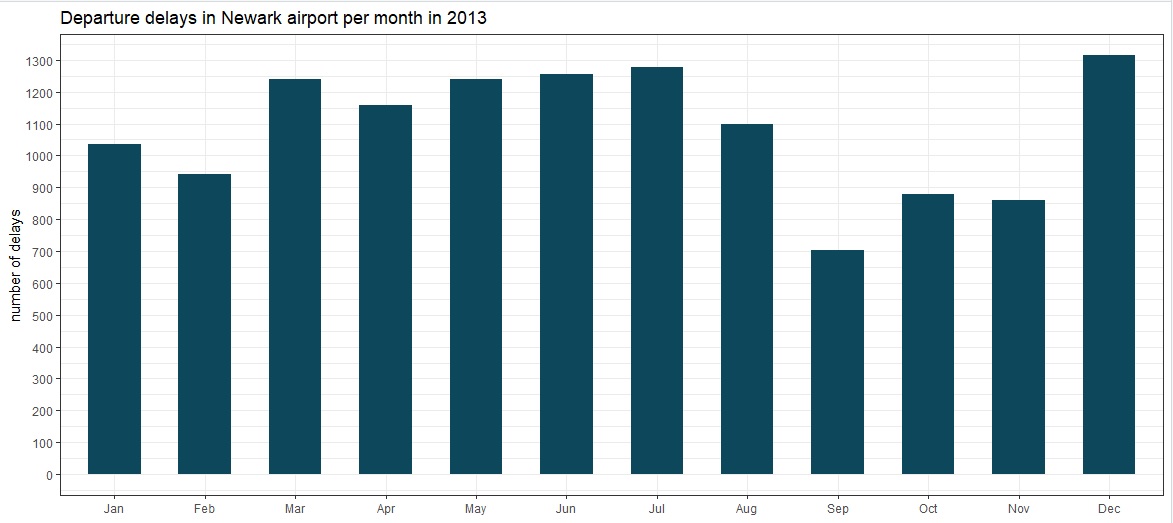
Is it possible to add the values on top of each bar?
the values are generated by the following code and represent the count of rows for each month
df%>% group_by(month=month(date)) %>% count()
  month     n
   <dbl> <int>
 1     1  1035
 2     2   941
 3     3  1239
 4     4  1159
 5     5  1240
 6     6  1257
 7     7  1277
 8     8  1100
 9     9   702
10    10   880
11    11   861
12    12  1315
how can I do that?