...I want to add a limit for Y and Y2 axis separately. But as my labels are different in both the axis, I am unable to add a line. Is there any way to add a line from Y to Y2 and Y2 to Y in the same graph?
Tried adding the "axis" parameter inside dylimt and used dygroup option too. But I didn't find any possible answer
I want to add a limit for Y and Y2 axis separately. But as my labels are different in both the axis, I am unable to add a line. Is there any way to add a line from Y to Y2 and Y2 to Y in the same graph?
Tried adding the "axis" parameter inside dylimt and used dygroup option too. But I didn't find any possible answer
UI.R
library(dygraphs)
library(shiny)
ui<- shinyUI(fluidPage(
dygraphOutput("dygraph2") ) )
SERVER.R
library(dygraphs)
library(datasets)
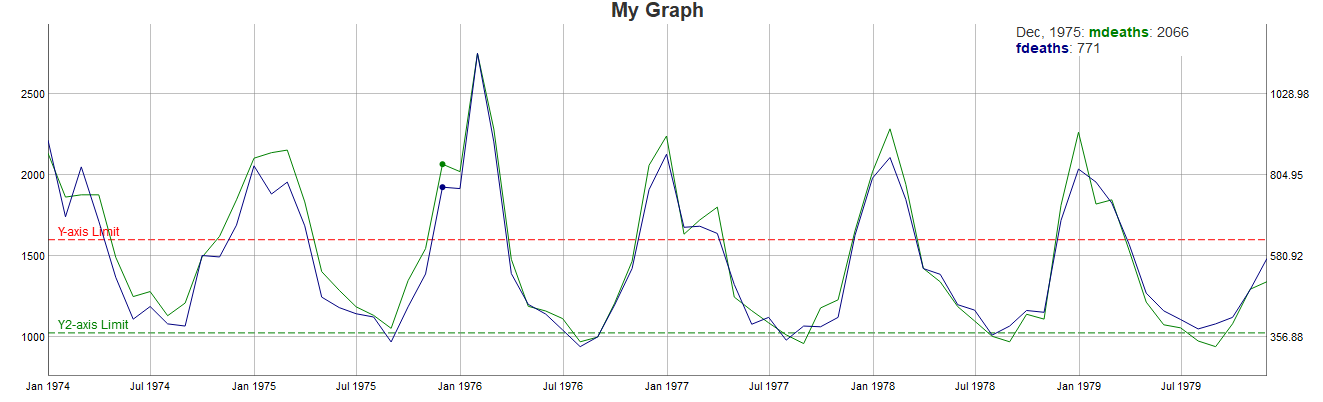
checkdf_y <- 1600 #Limit for Y-axis
checkdf_y2 <- 1025 #Limit for Y2-Axis
shinyServer(function(input, output) {
lungDeaths <- cbind(mdeaths, fdeaths)
output$dygraph2 <- renderDygraph({
dygraph(lungDeaths, main = "My Graph", group = "lung-deaths") %>%

  dySeries("fdeaths", axis = "y2")%>%

  dyLimit(checkdf_y,label = "Y-axis Limit",color = "red",strokePattern = "dashed")%>%

  dyLimit(checkdf_y2,label = "Y2-axis Limit",color = "green",strokePattern = "dashed")
}) })