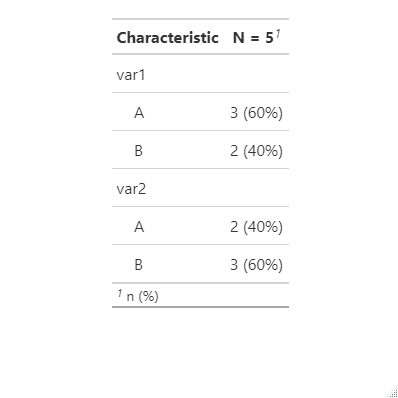
level Overall
  n              5
  var1 (%) A     3 (60.0)
           B     2 (40.0)
  var2 (%) A     2 (40.0)
           B     3 (60.0)
Or:
df %>%
tbl_summary()
Output:
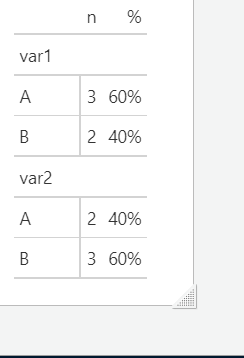
and I would like to know how to make them in 2 different columns like this:
n
%
var1
A
3
60
B
2
40
var2
A
2
40
B
3
60
How do i get this table? I export the table I get with Createtableone and I modiify it on excel so i can have the n and % in 2 columns, but I lost a lot of time doing it.
A handy way to supply some sample data is the dput() function. In the case of a large dataset something like dput(head(mydata, 100)) should supply the data we need.
First, while gtsummary is an R package, createtableone is a function in the tableone package.
In any case, both are explicitly intended to give that output which seems to be Table One in a research article in a medical journal. I don't think either are intended to do what you want.
Here is something that will give you the two tables you want, that is the calculated tables. If you need them in the format in your example above we will have to fuss around with one of the table packages.
It depends on the structure of the data and the desired layout. There are complete packages, for say, formatting the output of regression models. Also it may be simpler to handle more complex data.frames . The data you supplied was so simple that I decided the only way to do the job was brute force. There likely is a better may but I did not see it.
Things like p values or % by row instead of columns or stratified tables are quite possible if I understand the question. Without sample data for the types of tables you may need, it's impossible to say much more.