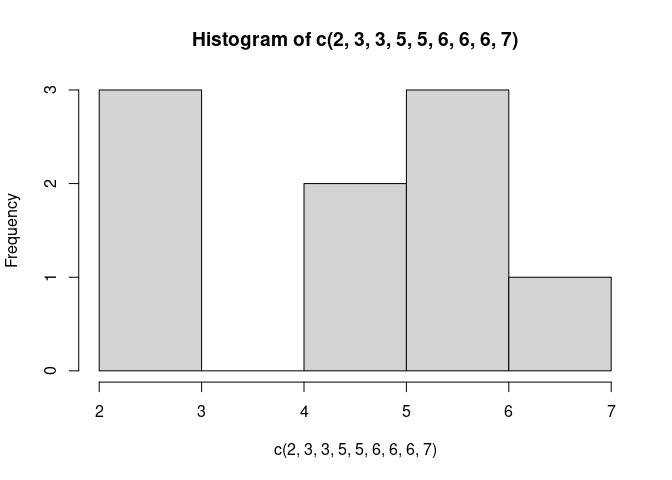
A density plot and a histogram are alternative ways of showing the distribution of a vector of numbers.
hist(c(2,3,3,5,5,6,6,6,7))
plot(density(c(2,3,3,5,5,6,6,6,7)))
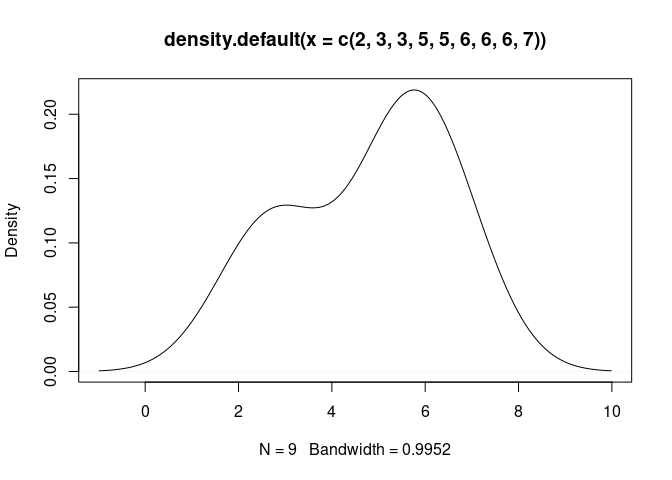
They differ in that the histogram bins observations into intervals while the density plot interpolates continuous values.
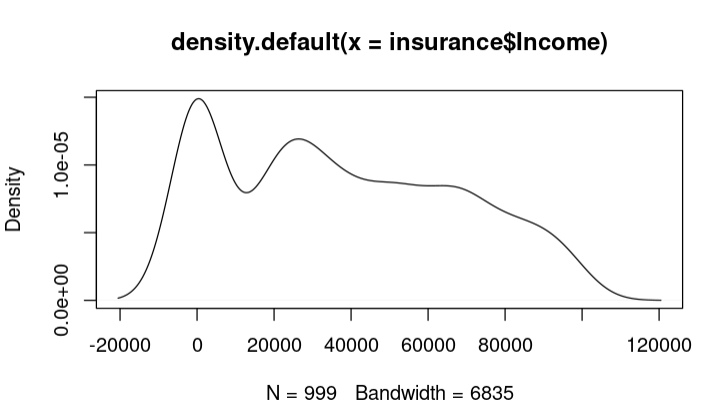
For your plot, the distribution is bimodal, having its primary peak at 0 and a secondary peak around 30000. Because the distribution is concentrated on the left, the plot can be described as right skewed and the trailing values to the right make the distribution fat tailed.
This topic was automatically closed 42 days after the last reply. New replies are no longer allowed.
If you have a query related to it or one of the replies, start a new topic and refer back with a link.