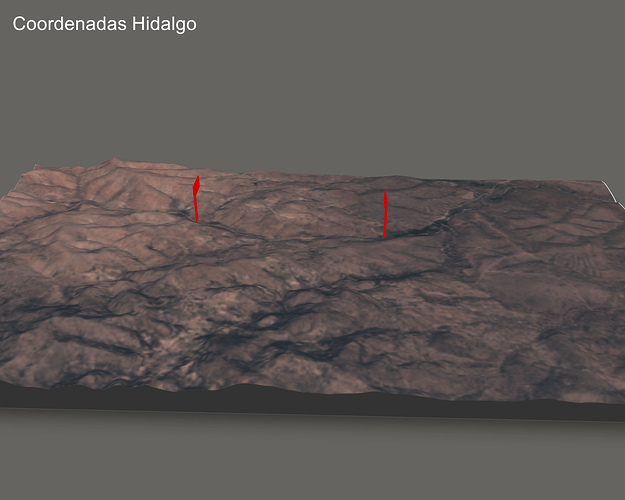
Hi community, Im want add coordinates point in a 3d map done with rayshader library but I can't do it. Im a little confused with the form for put coordinates points.
library(giscoR)
library(terra)
library(sf)
library(elevatr)
library(png)
library(rayshader)  # https://cran.r-project.org/web/packages/rayshader/rayshader.pdf
library(raster)
library(rnaturalearth)

# 2 CARGAR LA IMAGEN TIFF DESCARGADA DE SENTINEL --------------------------
TIF <- rast("path...Soar-Sentinel2_TRUE_COLOR_2024-09-17.tif") #get of drive link
crs(TIF)

# Obtener la variable SFC de Mexico
USA <- ne_states(country = c("United states of america"), returnclass = "sf")

## observar la variable sfc de USA
plot(st_geometry(USA))

sf_tif_bbox <- terra::ext(TIF) |>
  sf::st_bbox(crs = 3857) |>
  sf::st_as_sfc(crs = 3857) |>
  sf::st_transform(crs = 4326) |>
  sf::st_intersection(USA) |> st_as_sf()

plot(sf_tif_bbox)

modelo_dem <- elevatr::get_elev_raster(
  locations = sf_tif_bbox,
  z = 13, clip = "locations")


plot(modelo_dem)

## cambiar la proyeccion de la imagen tif

TIF_2 <- project(TIF, "EPSG:4326")

## aplicar la función resample
imagen_tif_resampled <- terra::resample(
  x = TIF_2,
  y = modelo_dem |> rast(),
  method = "bilinear")

img_file <- "path...TIF_2.png" #get of drive link

terra::writeRaster(
  imagen_tif_resampled,
  img_file,
  overwrite = T,
  NAflag = 255
)

### Cargamos la imagen resample
imagen <- png::readPNG("path...TIF_2.png")

# Paso 6: Convertir DEM a matriz para rayshader
elmat <- raster_to_matrix(modelo_dem)


elmat |> height_shade(
  texture = colorRampPalette(
    c("white", "grey80"))(128)) |>
  add_overlay(
    imagen,
    alphalayer = 1
  ) |>
  plot_3d(elmat, zscale = 8,
          theta = -0.5987271 , phi = 28.3084321,
          windowsize = c(1000, 800), zoom = 0.3768897,
          fov = 90,
          background = "#666460")

# Aca se hace la imagen segun este en el visualizador

render_snapshot(title_text = "Coordenadas Hidalgo",
                title_bar_color = "#666460", title_color = "white",
                title_bar_alpha = 1, text_size = '150',
                clear=TRUE, filename = "Hidalgo.png", samples = 1000,
                width = 1200, height = 800)

# Latitude: 31.518 ,  31.516
# Longitude: -109.003 , -108.987
The idea is try to put the coordinates points, like this. Is possible?
Im try to use render_points() function but dont run well.
tnks!

