Hi community,
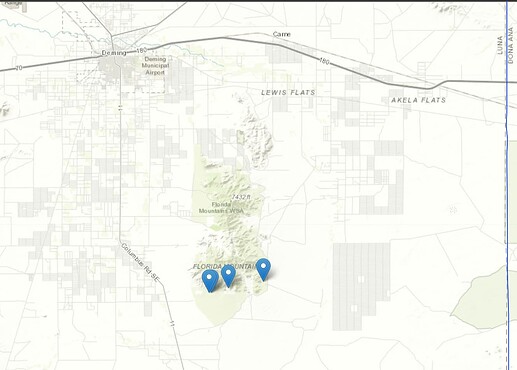
I'm want to make a map with ggplot2 for print on a sheet of paper. But I don't now how get the correct base map.
I'm try to reproduce the situation with leaflet but I don't now if is possible make this map in ggplot2. I'm try with ggmap but was necessary pay to access the API I don't like this.
NEW_MEX <- structure(list(County = c("Luna", "Luna", "Luna", "Luna", "Luna",
"Luna", "Dona Ana", "Dona Ana", "Dona Ana"), New_latitude = c(32.0375,
32.0333333333333, 32.0333333333333, 31.175, NA, 32.04444, NA,
32.22917, 31.8), longitude = c("107.37.30", "107.38.40", "107.38.50",
"107.36.50", NA, "107.35", NA, "106.34", "107.03"), New_longitude = c(-107.625,
-107.6444, -107.6472, -107.6139, NA, -107.583333333333, NA, -106.566666666667,
-107.05)), row.names = c(NA, -9L), class = c("tbl_df", "tbl",
"data.frame"))

library(leaflet)
library(sp)
library(sf)

adme <- geodata::gadm(country = 'USA', level = 2, path = '.') # USA MAP
adme <- st_as_sf(adme)

adme_1 <- adme %>%
  filter(NAME_1 == 'New Mexico' & NAME_2 %in% c('Luna', 'Dona Ana')) # Filter some's regions

popup <- paste0("<strong>Admin. division level 1: </strong>",
                adme_1$NAME_2)

leaflet() %>%
  addProviderTiles("Esri.WorldTopoMap") |>
  leaflet::addPolygons(data=adme_1, weight = 1, fillColor = "#FEF800",
            fillOpacity = 0.02, opacity = 1,smoothFactor = 0.1,popup=popup) |>
  leaflet::addMarkers(lat=NEW_MEX$New_latitude, lng=NEW_MEX$New_longitude,data = NEW_MEX,
                      popup =paste("<b> County:</b>",NEW_MEX$County,"<br>",
                                   "<b> Collector_NUM:</b>",NEW_MEX$`Collector and number`,"<br>",
                                   "<b> Latitude:</b>",NEW_MEX$New_latitude,"<br>",
                                   "<b> Longitude:</b>",NEW_MEX$New_longitude,"<br>"))
The idea is make zoom in but with ggplot2 for get a better resolutions of this map.
Tnks!
