Part of the goal is to keep the aesthetic mapping: scale_fill_manual() allows me to specify which items should appear in the legend, but at the same time seems to require that I specify the color values by hand.
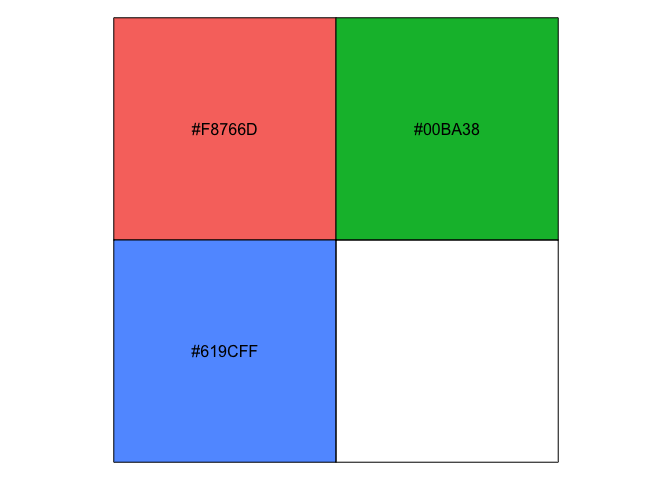
FWIW, you can access the default colours for the discrete palette using scales::hue_pal(). The show_col() function I'm using below is just a convenience function for printing the colours for you to see:
Created on 2020-02-13 by the reprex package (v0.3.0.9001)
Specifying this directly in scale_fill_manual() gets rid of the fill for the bar as well, but you might be able to do a workaround with one of the guides() functions.
Yikes! Update, this behaviour has changed in the development version such that the column is filtered out. I'll file an issue to make sure this is intended.
library(tidyverse)
my_colors <- scales::hue_pal()(3)
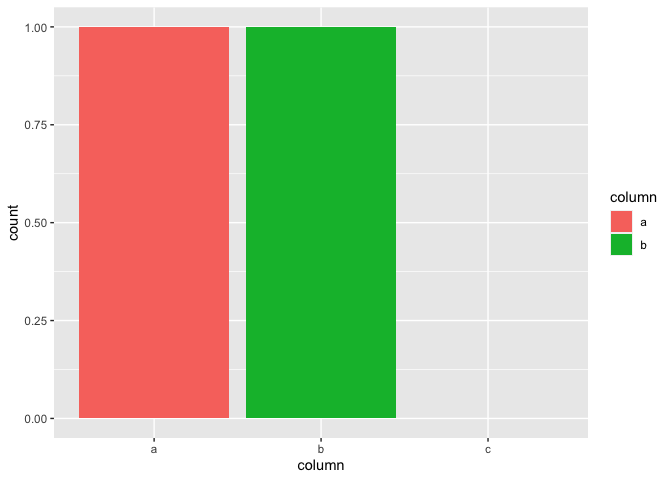
# add names so bar for 'c' gets fill, too
names(my_colors) <- letters[1:3]
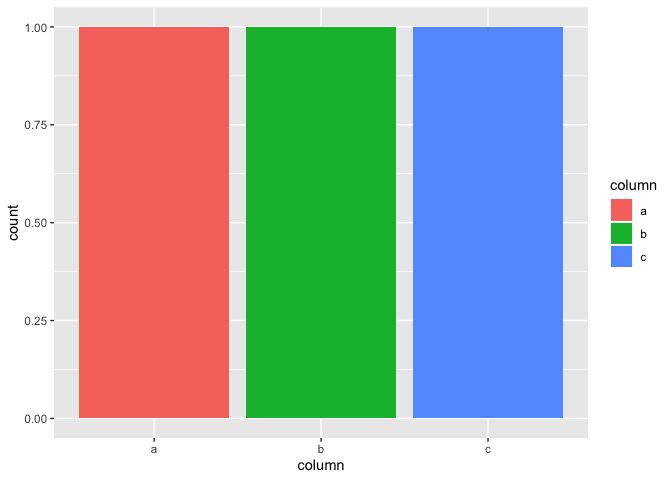
tibble(column = letters[1:3]) %>%
ggplot(aes(column)) +
geom_bar(aes(fill = column)) +
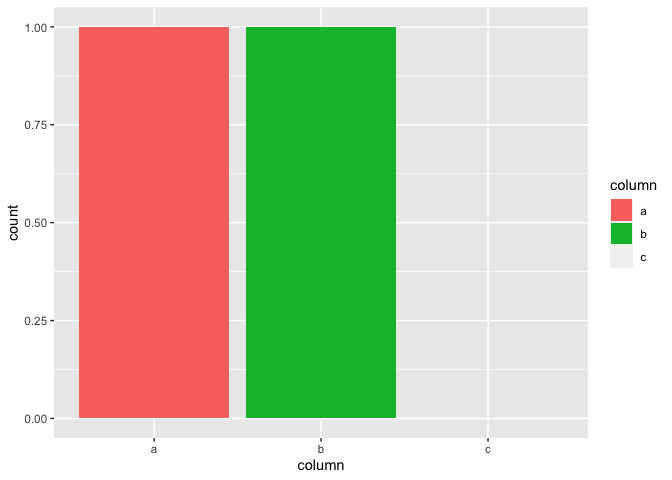
scale_fill_manual(
values = my_colors,
limits = c('a', 'b')
)
Created on 2020-02-13 by the reprex package (v0.3.0.9001)
This was an intended change. See the implementation PR for how it will work in subsequent releases:
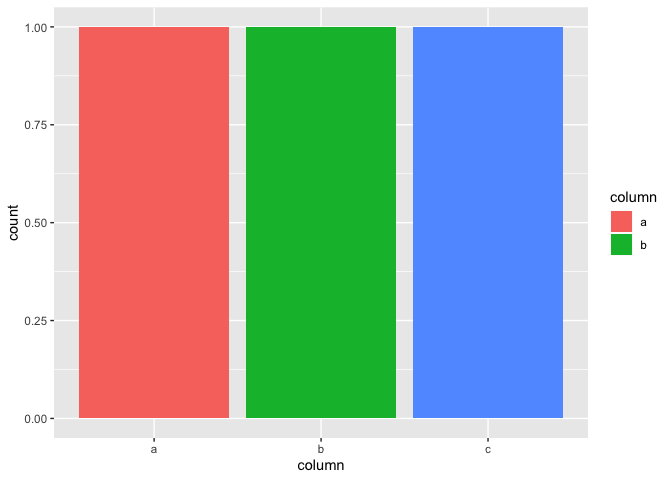
Thanks for the heads up, Mara, and for pointing to where I can dig further. I was able to achieve the same effect by replacing limits by breaks -- does that change anything for you? In looking through the current version of Hadley Wickham's ggplot2 book online, it seems that breaks may have been intended for this kind of tuning:
library(tidyverse)
my_colors <- scales::hue_pal()(3)

# add names so bar for 'c' gets fill, too
names(my_colors) <- letters[1:3]

tibble(column = letters[1:3]) %>%
  ggplot(aes(column)) +
  geom_bar(aes(fill = column)) +
  scale_fill_manual(
    values = my_colors,
    breaks = c('a', 'b')
    )