How highlight the roads in a leaflet map?

Hi community, I'm try to do a map with leaflet() but I can add the road base map. The idea is highlight the roads near for each coordinates.

Why is the better base map for show this?

Im try to use some example of Leaflet Provider Demo but all don't run well in my script.

How is the better base map and why all not run?

library(tidyverse)
library(readxl)
library(leaflet)

NUEVAS_COORDENADAS <- structure(list(`Coll. No.` = c(3387, 3388, 3389, 3390, 3391, 3392, 3393, 3394, 3395, 3396), 
                                     County = c("Dona Ana", "Dona Ana", "Dona Ana", "Dona Ana", "Dona Ana", "Luna", "Luna", "Grant", "Grant", "Grant"), 
                                     New_Lat = c(32.3719722222222, 32.3712777777778,32.3348888888889, 32.3370833333333, 32.3656111111111, 32.1489722222222, 
                                                 32.1489722222222, 33.0703055555556, 32.9730833333333, 32.64025), 
                                     New_Lng = c(-106.56225, -106.554805555556, -106.597777777778,-106.587111111111, -106.598666666667, -107.618111111111, 
                                                 -107.618111111111, -107.982416666667, -108.214222222222, -108.556527777778)), 
                                row.names = c(NA,-10L), class = c("tbl_df", "tbl", "data.frame"))

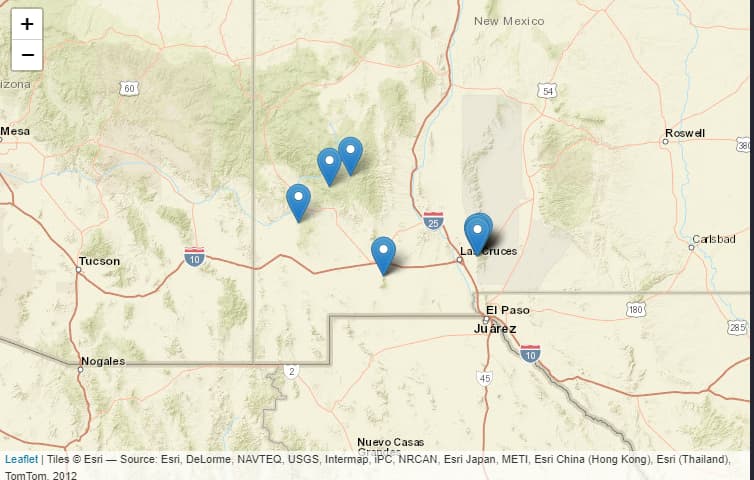
 leaflet()|>
  addProviderTiles(providers$Esri.WorldStreetMap)|>
  leaflet::addMarkers(lat=NUEVAS_COORDENADAS$New_Lat, 
                      lng=NUEVAS_COORDENADAS$New_Lng,data = NUEVAS_COORDENADAS,
                      popup =paste("<b> County:</b>",NUEVAS_COORDENADAS$County,"<br>",
                                   "<b> Coll. No:</b>",NUEVAS_COORDENADAS$`Coll. No.`,"<br>",
                                   "<b> Latitude:</b>",NUEVAS_COORDENADAS$New_Lat,"<br>",
                                   "<b> Longitude:</b>",NUEVAS_COORDENADAS$New_Lng,"<br>" ),
                      labelOptions = labelOptions(noHide = T))

Tnks
For highlighting roads, consider using the CartoDB.Positron or OpenStreetMap.Mapnik base maps, as they often provide clearer road details. Make sure your Leaflet version and provider tiles are correctly set up. You might also check if you have the necessary packages and dependencies updated. For more customization, you can overlay road data on top of the base map using addPolylines or similar functions.

1 Like

@abuislam Im change the base map, is well.

But you know how to highligth the principal road when the coordinates fall off?

For that, u could create a line layer between points using a routing provider like osrm that gives you the route points.

I have an example of that using mapboxer instead, but that's a similar logic, hope that works for u
Code:

library(osrm)
library(sf)
library(mapboxer)
library(dplyr, warn.conflicts = FALSE)

polygon <-
data.frame(
lon = c(-99.100001, -99.10000),
lat = c(19.0, 19.00001)
) |>
st_as_sf(coords = c("lon", "lat"), crs = 4326)

trip <- osrmRoute(loc = polygon, overview = "simplified")

mapboxer(
style = "mapbox://styles/jorgehdez1998/clixjvc7q00fv01pz1o6826l3",
token = "URTOKEN",
center = c(-102,23),
zoom = 4.5,
maxZoom = 10,
pitch = 45
) |>
add_line_layer(
source = as_mapbox_source(trip),
line_color = "#b36969",
line_width = 5,
id = "line"
)

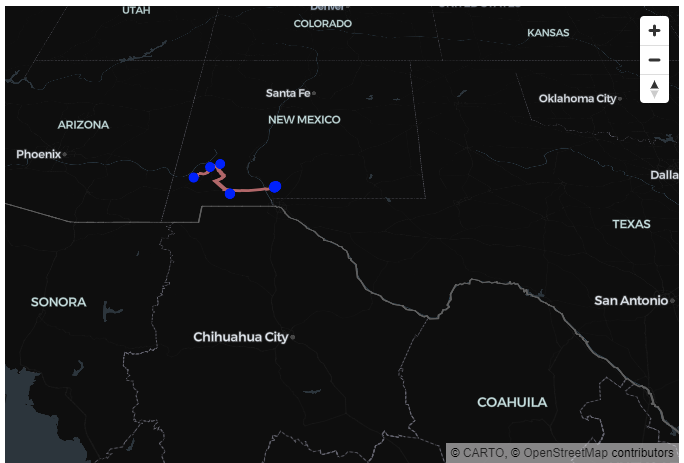
Im replicate your code and works fine.
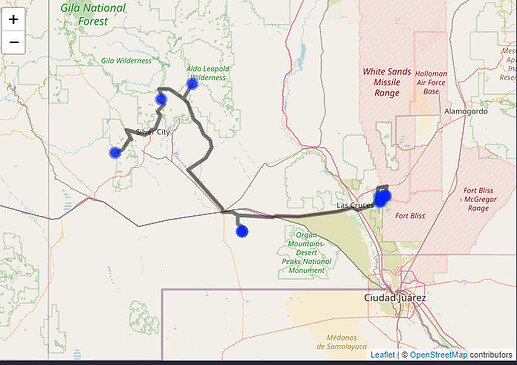
But it seems to me that the routes of the lines are different from leaflet and mapboxer base map :pensive:
Is there any way to combine the two shapes, trip with base map to get the exact path?

Any ideas for make better?

library(osrm)
library(sf)
library(mapboxer)
library(dplyr, warn.conflicts = FALSE)

polygon <-
  data.frame(
    lon = c(-106.56225, -106.554805555556, -106.597777777778,-106.587111111111, -106.598666666667, -107.618111111111, 
            -107.618111111111, -107.982416666667, -108.214222222222, -108.556527777778),
    lat = c(32.3719722222222, 32.3712777777778,32.3348888888889, 32.3370833333333, 32.3656111111111, 32.1489722222222, 
            32.1489722222222, 33.0703055555556, 32.9730833333333, 32.64025)
  ) |>
  st_as_sf(coords = c("lon", "lat"), crs = 4326)

trip <- osrmRoute(loc = polygon, overview = "full")

mapboxer(
  #style = 'mapbox://styles/jorgehdez1998/clixjvc7q00fv01pz1o6826l3', # not run 
  #token = "URTOKEN", # I dont have token 
  center = c(-105,31),
  zoom = 5,
  maxZoom = 10,
  pitch = 45
) |>
  add_line_layer(
    source = as_mapbox_source(trip),
    line_color = "#b36969",
    line_width = 5,
    id = "line"
  ) |> 
  add_navigation_control() |> 
  add_circle_layer(
    source = as_mapbox_source(polygon),
    circle_color = 'blue',
    circle_radius = 6, 
     popup = "<b>Coordenadas:</b><br>Longitude: {{lon}}<br>Latitude: {{lat}}")

image

polygon_sf <- st_as_sf(polygon, coords = c("lon", "lat"), crs = 4326)

leaflet() |> 
  addProviderTiles(providers$OpenStreetMap) |> 
  addPolylines(data = trip, color = "black", weight = 5) |> 
  addCircleMarkers(
    data = polygon_sf, 
    radius = 6,  
    color = "blue",
    fillColor = "blue",
    fillOpacity = 0.7,
    popup = ~paste0("<b>Coordenadas:</b><br>Longitude: ", round(st_coordinates(polygon_sf)[,1], 6), 
                    "<br>Latitude: ", round(st_coordinates(polygon_sf)[,2], 6)) )