I am wondering how to facet_wrap or subplotmultiple plots (around 200) graphs in flexdashboard page if possible?
---
title: "example"
output:
  flexdashboard::flex_dashboard:
    orientation: columns
    vertical_layout: fill
---

```{r setup, include=FALSE}
library(flexdashboard)
library(tidyverse)

list_of_plots <- list(ggplot(mpg,aes(x=cty,y=hwy))+geom_point(),
     ggplot(iris,aes(x=Sepal.Length,y=Petal.Length))+geom_point())

list_of_facet_vars <- list("manufacturer","Species")

final_plots <- map2(list_of_plots,list_of_facet_vars,
      ~{.x + facet_wrap(.y)})
```

Column {data-width=350}
-----------------------------------------------------------------------

### Chart A

```{r}
final_plots[[1]]

```

Column {data-width=350}
-----------------------------------------------------------------------

### Chart B

```{r}
final_plots[[2]]

```Dear Sir,
I would like to facet 200 plots in the one page with fill vectical_layout.
---
title: "example"
output:
  flexdashboard::flex_dashboard:
    orientation: columns
    vertical_layout: scroll
---

```{r setup, include=FALSE}
library(flexdashboard)
library(plotly)
list_of_plots <- lapply(1:200, function(x) plot_ly(economics, x = ~pop))
Column {data-width=1000}
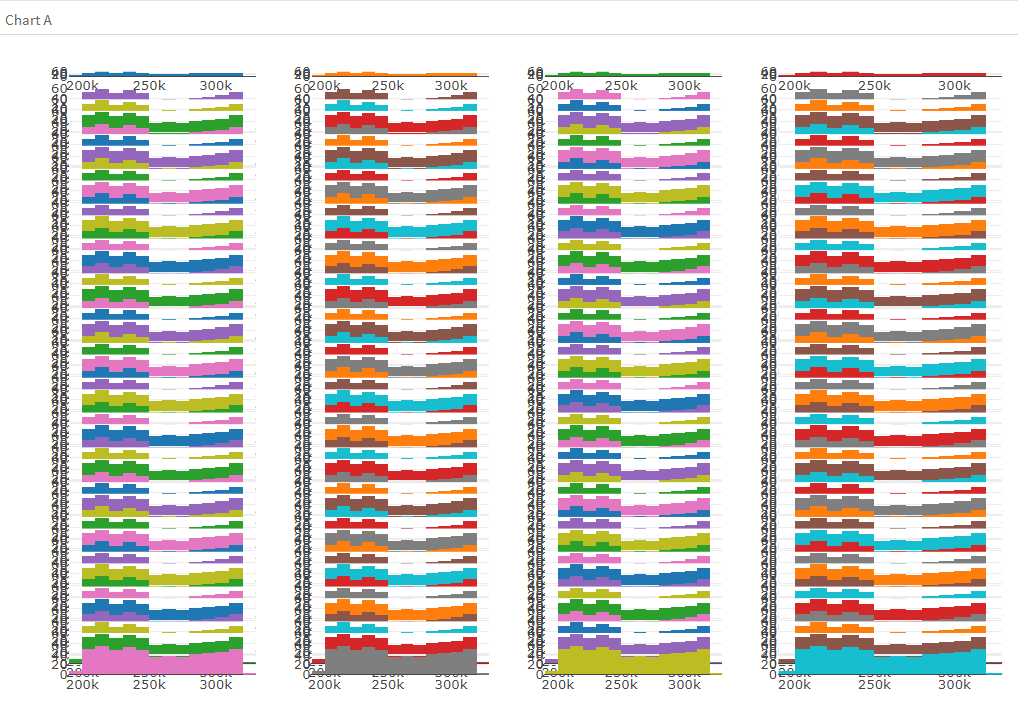
Chart A
subplot(list_of_plots, nrows = 60,
          # l, r, t, b
          margin = c(0.01, 0.05, 0.05, 0.01),
          heights = rep(1/60, 60), titleY = FALSE)
The picture looks very bad. Please advise
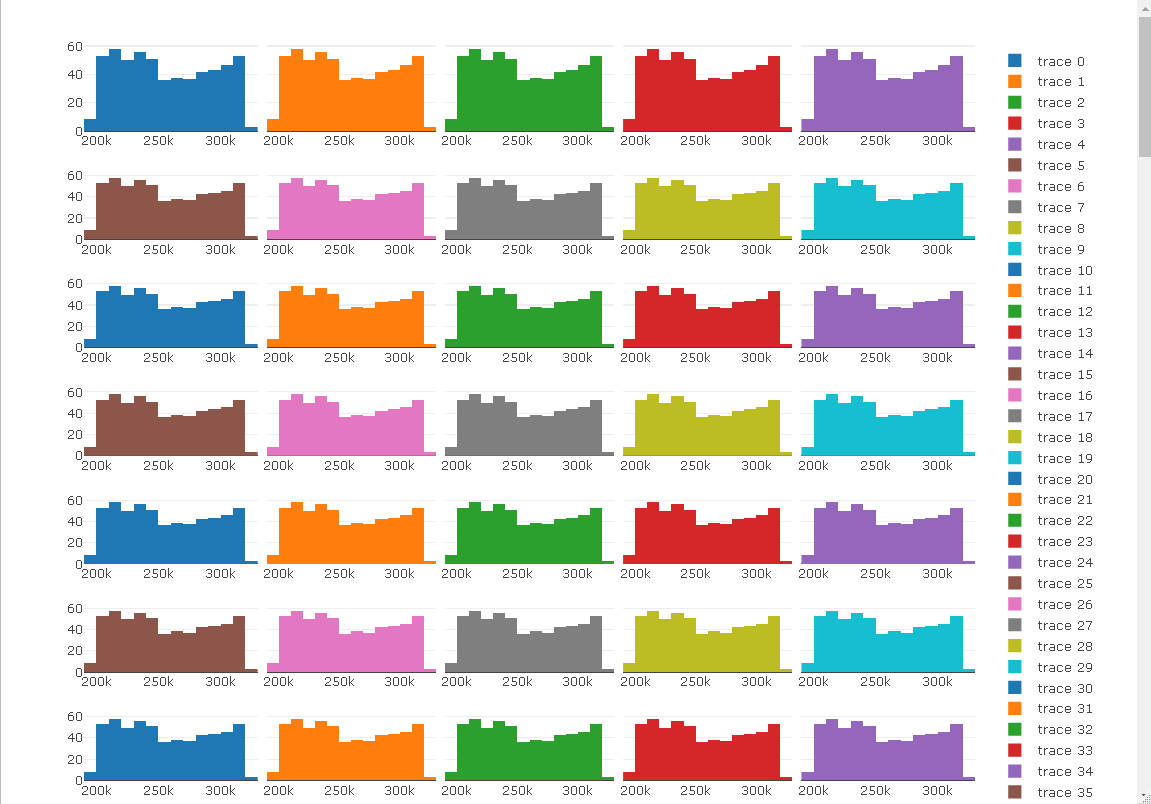
library(plotly)
list_of_plots <- lapply(
  1:200,
  function(x) {
    plot_ly(economics,
      x = ~pop,
      height = 4000,
      width = 1000
    )
  }
)

subplot(list_of_plots,
        nrows = 40,
        margin = 0.005,
        shareY = TRUE)
This topic was automatically closed 7 days after the last reply. New replies are no longer allowed.
If you have a query related to it or one of the replies, start a new topic and refer back with a link.