how does the sequence of palette color in dyRibbon get decided?

Update on May 21: Due to no response I have posted this on stackoverflow also.

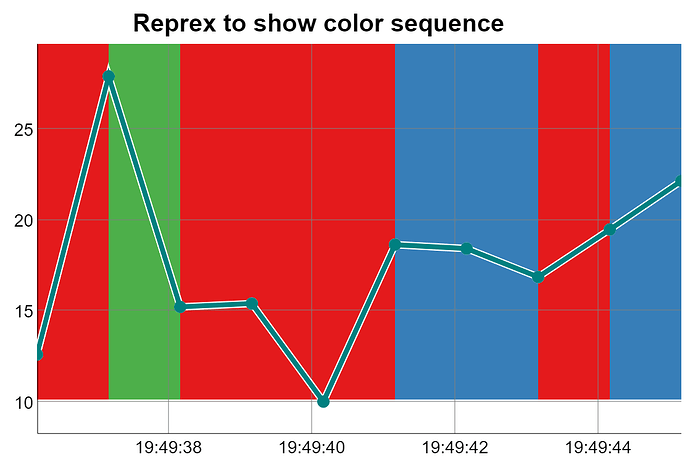
Consider this reprex. Pay attention to the sequence of colors, as that is the question I have.
Q1. Why do we need 4 colors for a 3 ribbon display? The first one is always ignored.
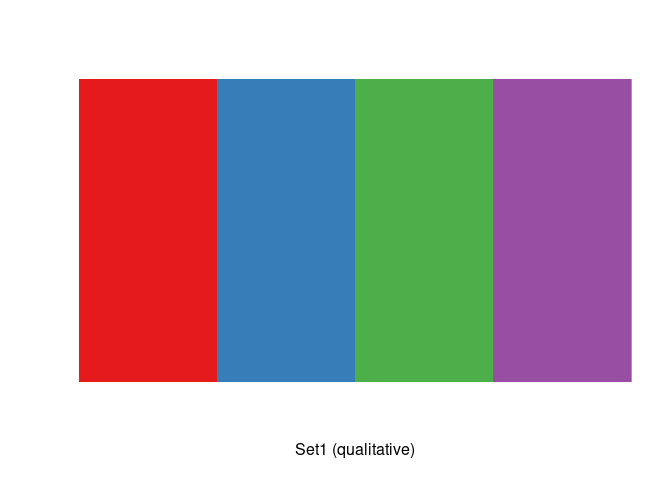
Q2. How is the sequence of the color palette assigned? It is not per the numerical order.

library(data.table)
library(dygraphs)
library(RColorBrewer)
library(dplyr)

set.seed(12)
# create data
dt1 <- data.table(t = seq(Sys.time(),by  = "1 sec", length.out = 10),
                  y = rnorm(10,20,5))
# add a column with 3 possible values to be used for dyRibbon
dt1[,flag1:=factor(dplyr::case_when(y>22 ~ "high",y>18 ~ "med", T ~ "low"))]
dt1[,rflagn:=as.numeric(flag1)]

# generate the dygraph with a 3 color ribbon
dyg1 <- 
  dt1 %>% 
  select(t,y) %>% 
  dygraph(main = "Reprex to show color sequence") %>% 
  dyOptions(drawPoints = T,pointSize = 5,drawGapEdgePoints = T,
            strokeWidth = 4,strokeBorderWidth = 1) %>% 
  dyRibbon(dt1$rflagn/4,palette = brewer.pal(4,"Set1"))

# checkout the reprex graph paying attention to the sequence of colors
dyg1

# check the sequence of colors in the palette
display.brewer.pal(4,"Set1")
# check the actual values in first 10 rows
dt1
#>                       t        y flag1 rflagn
#>  1: 2022-05-18 21:47:10 12.59716   low      2
#>  2: 2022-05-18 21:47:11 27.88585  high      1
#>  3: 2022-05-18 21:47:12 15.21628   low      2
#>  4: 2022-05-18 21:47:13 15.39997   low      2
#>  5: 2022-05-18 21:47:14 10.01179   low      2
#>  6: 2022-05-18 21:47:15 18.63852   med      3
#>  7: 2022-05-18 21:47:16 18.42326   med      3
#>  8: 2022-05-18 21:47:17 16.85872   low      2
#>  9: 2022-05-18 21:47:18 19.46768   med      3
#> 10: 2022-05-18 21:47:19 22.14007  high      1

Created on 2022-05-18 by the reprex package (v2.0.1)
You don't need 4 colors, you are passing 4 arbitrarily, the code works fine with just 3

It gets assigned in the same order each level is defined. I think your confusion comes from incorrectly scaling the data argument for the dyRibbon() function, it must be a numeric vector scaled from 0 to 1. Take a look at this example:

library(dplyr)
library(dygraphs)
library(RColorBrewer)
library(data.table)

set.seed(12)
# create data
dt1 <- data.table(t = seq(Sys.time(),by  = "1 sec", length.out = 10),
                  y = rnorm(10,20,5))
# add a column with 3 possible values to be used for dyRibbon
dt1[,flag1:=factor(dplyr::case_when(y>22 ~ "high",y>18 ~ "med", T ~ "low"))]

data_arg <- dt1 %>% 
    mutate(flagn = case_when(
        flag1 == "low" ~ 0,
        flag1 == "med" ~ 0.5,
        flag1 == "high" ~ 1)) %>% 
    pull(flagn)

dt1 %>% 
    select(t,y) %>%
    dygraph(main = "Reprex to show color sequence") %>% 
    dyOptions(drawPoints = T,pointSize = 5,drawGapEdgePoints = T,
              strokeWidth = 4,strokeBorderWidth = 1) %>% 
    dyRibbon(data = data_arg, palette = brewer.pal(3,"Set1"))

Got it. I think I was trying to avoid one step of generating the data argument, which you did to keep the sequence unambigous. I guess the problem was the factor levels even if ordered are not accepted in the palette sequence. Making it explicit by the case_when() solves this problem.
Thanks.

This topic was automatically closed 7 days after the last reply. New replies are no longer allowed.

If you have a query related to it or one of the replies, start a new topic and refer back with a link.