library(tidyverse)
#> Warning: package 'purrr' was built under R version 4.3.1
#> Warning: package 'dplyr' was built under R version 4.3.1
d <- sf::st_read(system.file("shape/nc.shp", package = "sf"))
#> Reading layer `nc' from data source
#> `C:\Users\david\AppData\Local\R\win-library\4.3\sf\shape\nc.shp'
#> using driver `ESRI Shapefile'
#> Simple feature collection with 100 features and 14 fields
#> Geometry type: MULTIPOLYGON
#> Dimension: XY
#> Bounding box: xmin: -84.32385 ymin: 33.88199 xmax: -75.45698 ymax: 36.58965
#> Geodetic CRS: NAD27
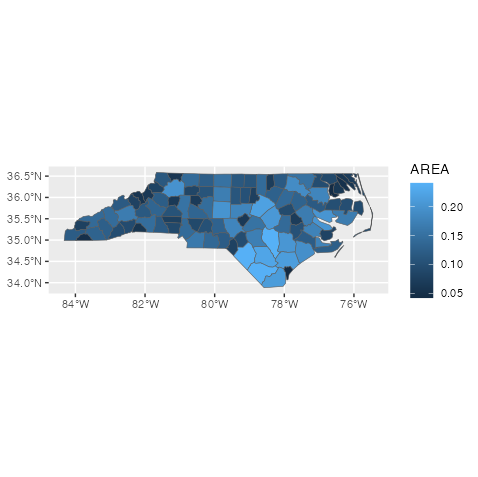
p <- d |>
ggplot() +
geom_sf(aes(fill = AREA))
p
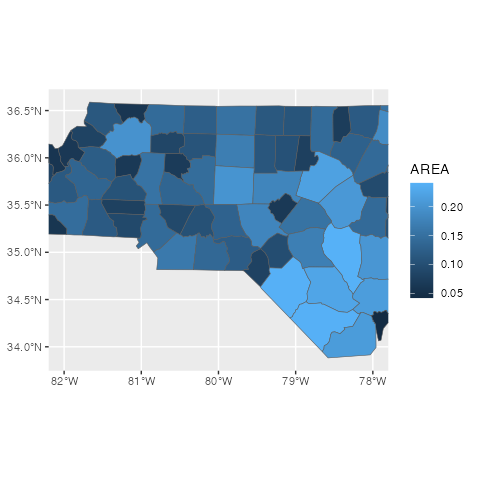
By the time it get's past geom_sf, it's just an ordinary ggproto object and you can apply the breaks and limits arguments in the ordinary way, such as below (not that one would actually want to for the example)
library(ggplot2)
library(sf)
#> Linking to GEOS 3.11.0, GDAL 3.5.3, PROJ 9.1.0; sf_use_s2() is TRUE
d <- sf::st_read(system.file("shape/nc.shp", package = "sf"))
#> Reading layer `nc' from data source
#>   `/Library/Frameworks/R.framework/Versions/4.3-arm64/Resources/library/sf/shape/nc.shp'
#>   using driver `ESRI Shapefile'
#> Simple feature collection with 100 features and 14 fields
#> Geometry type: MULTIPOLYGON
#> Dimension:     XY
#> Bounding box:  xmin: -84.32385 ymin: 33.88199 xmax: -75.45698 ymax: 36.58965
#> Geodetic CRS:  NAD27

p <- d |>
  ggplot() +
  geom_sf(aes(fill = AREA))

p