Hello dear R community,
I'm trying to improve my histogram graphs of dataframe to display a key information additionally. So I would like print a legend that show the following things:
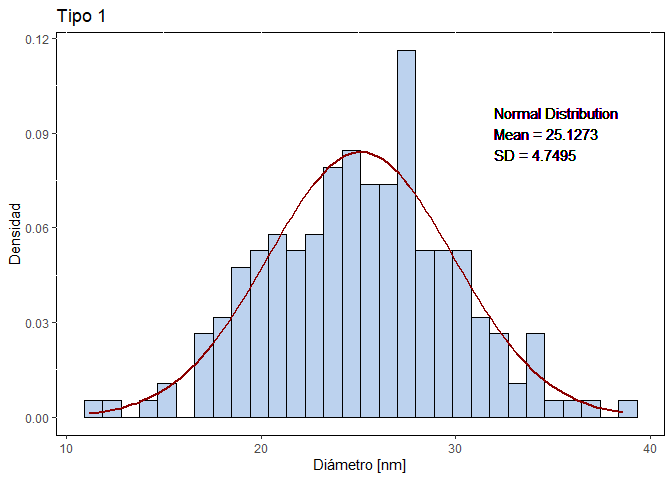
Tittle: "normal distribution"
mu(symbol) = (mean value)
sigma(symbol) = (standar deviation value)
The problem is that, I can't make possible to show even the float legend structure to proceed edit that in the graph.
Here is my code:
Read data frame
No_porosa <- read.csv("Nano1.csv", header = TRUE, sep = ",")
Build histogram for non-porous nanoparticles
library(ggplot2)
Breaks for method of FD (1981)
nbreaks3 <- pretty(range(No_porosa), nclass.FD(unlist(No_porosa), digits = 5), min.n = 1)
Printing the plot
ggplot(data.frame(No_porosa), aes(x = Diametro..nm.)) +
geom_histogram(breaks = nbreaks3, color = "black", fill = "lightsteelblue2", aes(y = ..density..)) +
geom_function(fun = dnorm, args = list(mean = mean(No_porosa$Diametro..nm.),
sd = sd(No_porosa$Diametro..nm.)),
colour = "red4", size = 1) +
theme(panel.background = element_rect(fill = "white", color = "black")) +
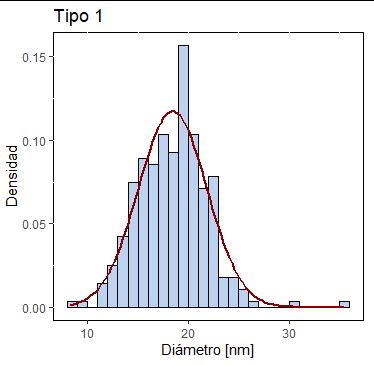
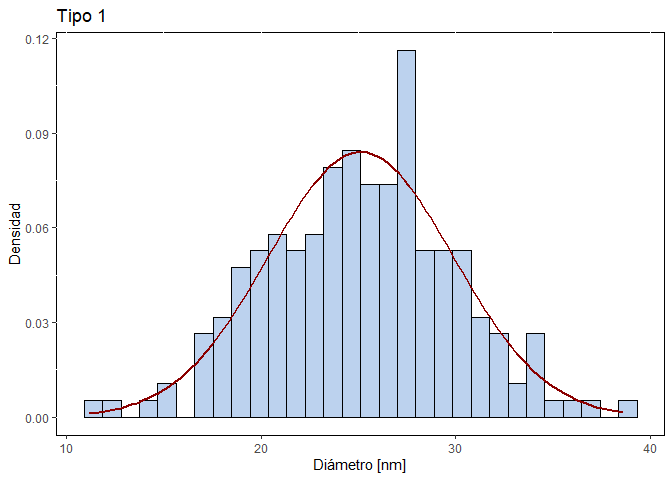
labs(title = "Tipo 1", x = "Diámetro [nm]", y = "Densidad")
I have tried with "fill = ", "color = ", and "alpha =" inside aes(x, ...) function without succeed, that based on this page: Legends in ggplot2 [Add, Change Title, Labels and Position or Remove] | R CHARTS
Please, help me.... My desire is print a legend for normal distribution line generated by "geom_function" in ggplot 2.