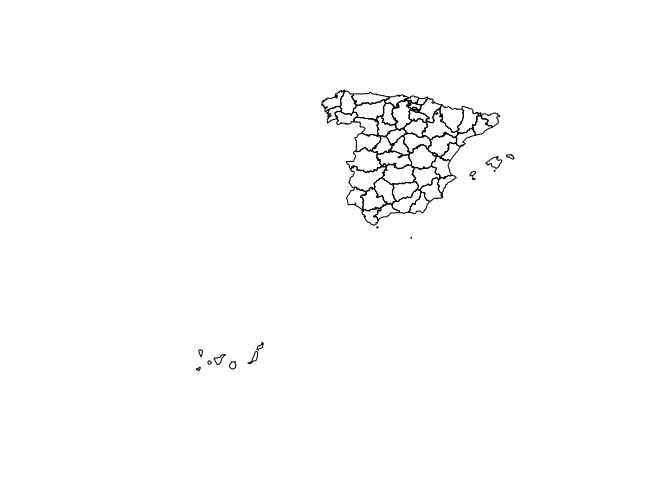
Hi, I would like to plot the regions of Spain in this map; here's the code:
library(maps)
library(mapdata)
library(ggplot2)
library(cartography)
library(sp)

map1 <- fortify(map("world", fill=TRUE, plot=FALSE))

gg <- ggplot()
gg <- gg + geom_map(data=map1, map=map1,
                    aes(x=long, y=lat, map_id=region),
                    fill="gray ", color="black")
gg <- gg + geom_map(data=data.frame(region="Spain"), map=map1,
                    aes(map_id=region), fill=" cornsilk ")
gg <- gg + xlim(-9.5,4.5) + ylim(35,44) + theme(panel.background = element_rect(fill = '#e0f3f8'))+ coord_map()+theme_void
The fact is that albeit I can plot the map I can't figure out how to plot internal borders on it.
Thank you in advance!