Hi all,
So I have some NBA data and I've done some Bayesian stats on it, and I'm trying to make it into a pretty table. Here is what I currently have:
Player <- c("Russel Westbrook", "James Harden", "Kawhi Leonard", "Lebron James",
"Isaiah Thomas", "Stephen Curry", "Giannis Antetokounmpo", "John Wall",
"Anthony Davis", "Kevin Durant")
Overall_proportion <- c(0.845, 0.847, 0.880, 0.674, 0.909, # q-the ratio of clutch makes
0.898, 0.770, 0.801, 0.802, 0.875) # by clutch attempts
Clutch_makes <- c(64, 72, 55, 27, 75, # Y-values
24, 28, 66, 40, 13)
Clutch_attempts <- c(75, 95, 63, 39, 83, # Clutch_attempts -values
26, 41, 82, 54, 16)
NBA_stats <- as.data.frame(cbind(Player, Overall_proportion, Clutch_makes, Clutch_attempts))
library(gt)
library(tidyverse)
library(glue)
# creating the various quartiles for the posterior distributions
q25 <- qbeta(0.250, Clutch_makes + 1, Clutch_attempts - Clutch_makes + 1)
q50 <- qbeta(0.500, Clutch_makes + 1, Clutch_attempts - Clutch_makes + 1)
q75 <- qbeta(0.750, Clutch_makes + 1, Clutch_attempts - Clutch_makes + 1)
q90 <- qbeta(0.900, Clutch_makes + 1, Clutch_attempts - Clutch_makes + 1)
q_low <- qbeta(0.025, Clutch_makes + 1, Clutch_attempts - Clutch_makes + 1)
q_high <- qbeta(0.975, Clutch_makes + 1, Clutch_attempts - Clutch_makes + 1)
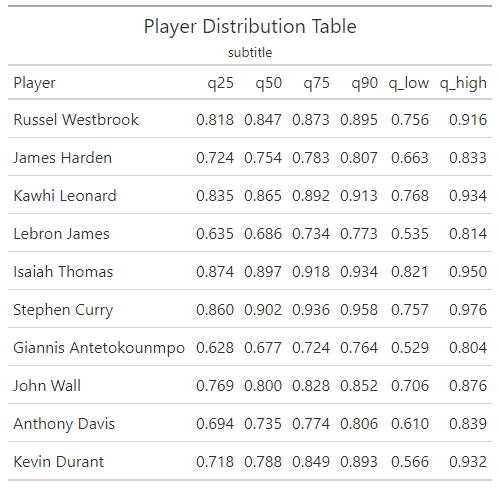
Player_distribution_table <- cbind(q25, q50, q75, q90, q_low, q_high)
rownames(Player_distribution_table) <- Player
kable(Player_distribution_table)
However, I'd love to try and turn this into something like this:
library(gt)
library(tidyverse)
library(glue)

# Define the start and end dates for the data range
start_date <- "2010-06-07"
end_date <- "2010-06-14"

# Create a gt table based on preprocessed
# `sp500` table data
sp500 %>%
  dplyr::filter(date >= start_date & date <= end_date) %>%
  dplyr::select(-adj_close) %>%
  gt() %>%
  tab_header(
    title = "S&P 500",
    subtitle = glue::glue("{start_date} to {end_date}")
  ) %>%
  fmt_date(
    columns = vars(date),
    date_style = 3
  ) %>%
  fmt_currency(
    columns = vars(open, high, low, close),
    currency = "USD"
  ) %>%
  fmt_number(
    columns = vars(volume),
    suffixing = TRUE
  )
where the row names in the table are each of the players and the column names are "25th percentile, 50th percentile" etc.
I know how to do this in SAS but I'm on a mac and SAS on macs is annoying, and besides, R is better. I like R 
Any help would be appreciated! It's not a crazy urgent matter or anything, I just want to learn how to make pretty tables with standard numeric data is all. Thanks again!