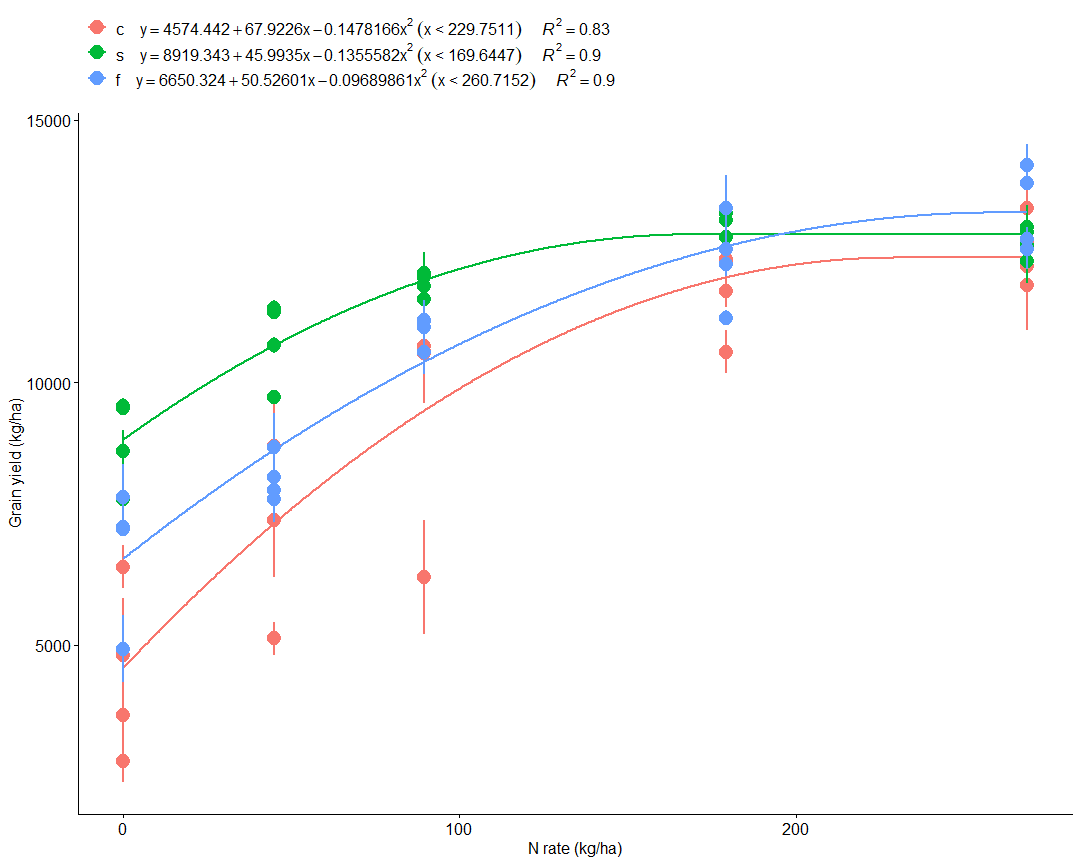
Good evening, all, please I have a question, considering the attached figure below, how do I know that the three agronomic optimum N rate are different. I am thinking of bootstrap approach, but I don't know how to go about that. I will really appreciate it if someone can help me out.
Data
Corn data
corn_mo <- structure(
  list(
    N = c(
      179.2,
      268.8,
      89.6,
      0,
      44.8,
      0,
      89.6,
      44.8,
      179.2,
      268.8,
      44.8,
      268.8,
      89.6,
      0,
      179.2,
      89.6,
      268.8,
      0,
      44.8,
      179.2
    ),
    hist = c(
      "c",
      "c",
      "c",
      "c",
      "c",
      "c",
      "c",
      "c",
      "c",
      "c",
      "c",
      "c",
      "c",
      "c",
      "c",
      "c",
      "c",
      "c",
      "c",
      "c"
    ),
    yldstdkgha = c(
      12346.9249590533,
      11860.0460239527,
      6286.35275360947,
      2793.90516411834,
      5127.27805576331,
      3660.44141822485,
      10565.0201115266,
      7381.04619323077,
      10584.2536581302,
      12692.5976236686,
      8795.41415233136,
      13314.8147184852,
      10684.0892228166,
      6489.22772449704,
      12286.5138609231,
      10587.1551712189,
      12207.7824999763,
      4808.05912842604,
      8768.34316118343,
      11741.9321865089
    )
  ),
  row.names = c(NA, -20L),
  class = c("tbl_df", "tbl", "data.frame")
)
Soybean data
soybean_mo <- structure(
  list(
    N = c(
      268.8,
      89.6,
      179.2,
      0,
      44.8,
      89.6,
      268.8,
      179.2,
      44.8,
      0,
      268.8,
      0,
      44.8,
      179.2,
      89.6,
      89.6,
      268.8,
      0,
      179.2,
      44.8
    ),
    hist = c(
      "s",
      "s",
      "s",
      "s",
      "s",
      "s",
      "s",
      "s",
      "s",
      "s",
      "s",
      "s",
      "s",
      "s",
      "s",
      "s",
      "s",
      "s",
      "s",
      "s"
    ),
    yldstdkgha = c(
      12312.7660459172,
      12086.4480249941,
      12772.9435023905,
      7781.93368615385,
      10711.1602139645,
      11582.7898622485,
      12617.2233679527,
      13225.3150068639,
      11339.0543647811,
      9553.99606381065,
      12957.7648473373,
      8697.03144369231,
      9722.50007176331,
      12775.756836355,
      12011.991252071,
      11842.0952736568,
      12872.0694350769,
      9509.94219323077,
      13085.1710848757,
      11423.857488284
    )
  ),
  row.names = c(NA, -20L),
  class = c("tbl_df", "tbl", "data.frame")
)
Fallow data
fallow_mo <- structure(
  list(
    N = c(
      0,
      179.2,
      268.8,
      44.8,
      89.6,
      0,
      44.8,
      179.2,
      89.6,
      268.8,
      179.2,
      89.6,
      0,
      44.8,
      268.8,
      44.8,
      268.8,
      0,
      179.2,
      89.6
    ),
    hist = c(
      "f",
      "f",
      "f",
      "f",
      "f",
      "f",
      "f",
      "f",
      "f",
      "f",
      "f",
      "f",
      "f",
      "f",
      "f",
      "f",
      "f",
      "f",
      "f",
      "f"
    ),
    yldstdkgha = c(
      7813.41363351479,
      12249.8439422485,
      13803.4656340828,
      7778.30574504142,
      11177.9322092308,
      4926.47739379882,
      7942.4952744142,
      11233.1764305799,
      10579.7313287574,
      12547.0432825562,
      13313.2421907692,
      11158.0877072663,
      7208.26549775148,
      8189.39052383432,
      14138.8465351953,
      8773.69689372781,
      12733.0655431953,
      7236.61298669823,
      12536.2749318817,
      11056.5389481657
    )
  ),
  row.names = c(NA, -20L),
  class = c("tbl_df", "tbl", "data.frame")
)
PACKAGES
library(tidyverse)
library(AgroReg)
library(patchwork)
Fit the N response curve using quadratic plateau
p1_corn <- quadratic.plateau(trat = corn_mo$N,resp = corn_mo$yldstdkgha,ylab = 'Grain yield (kg/ha)',xlab = 'N rate (kg/ha)',point = 'mean')
p2_soybean <- quadratic.plateau(trat = soybean_mo$N,resp = soybean_mo$yldstdkgha,ylab = 'Grain yield (kg/ha)',xlab = 'N rate (kg/ha)',point = 'mean')
p3_fallow <- quadratic.plateau(trat = fallow_mo$N,resp = fallow_mo$yldstdkgha,ylab = 'Grain yield (kg/ha)',xlab = 'N rate (kg/ha)',point = 'mean')
Merge the plot
plot_arrange(
  list(p1_corn, p2_soybean, p3_fallow),
  trat  = c('"c"', '"s"', '"f"'),  # use your real labels
  ylab  = "Grain yield (kg/ha)",
  xlab  = "N rate (kg/ha)",point = 'mean',
  theme = theme_classic()
)