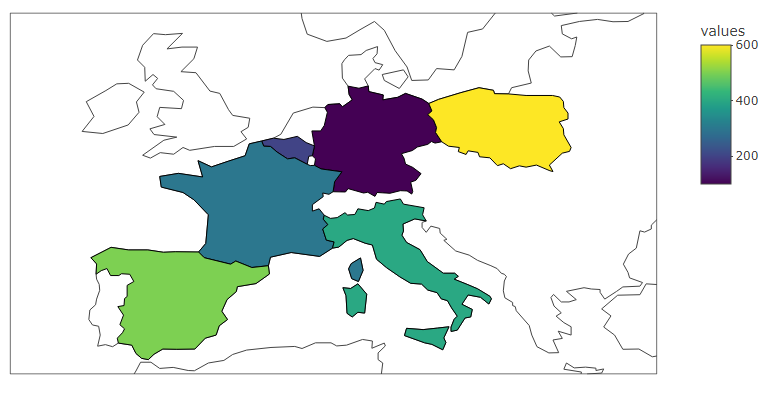
I am following the code from this website and trying to plot some data on an interactive map using ploty. Difference is I only have data for 6 euro pean countries. Currently the map is plotting for the entire world. How do I adjust the code to zoom in on either all of Europe or just the 6 European countries in the data. See sample code below. The country codes are from thislink.
# Libraries
library(tidyverse)
library(plotly)

# Data
countries <- c("Germany", "Belgium", "Framce", "Italy", "Spain", "Poland")
codes     <- c("DEU", "BEL", "FRA", "ITA", "ESP", "POL")
values    <- c(100, 200, 300, 400, 500, 600)

df <- tibble(countries, codes, values)

# Maps
plot_geo(locations = df$codes) %>%
    add_trace(
        z = ~values,
        locations = ~codes,
        color = ~values
    )